
DART News & Announcements
The following is the current status and other information for DART users:
NEW. Hourly Adult Fishway Counts with River Environment. The DART Hourly Adult Fishway Counts with River Environment query generates plots and hourly detail tables for specific adult fishway ladders in the mainstem Columbia River and lower Snake River, April - October.

UPDATED and EXPANDED. DART PIT Tag Columbia Basin ESU & DPS Smolt-to-Adult Return (SAR) Survival analyses require a minimum of 7 adults detected within each pooled period for SAR analysis. (Requirement implemented since 2024-03-21 for all queries.)
Two new options have been added:
- Lower Granite (Bypass Route): All juvenile detections at Lower Granite bypass/transport facilities (GRJ). Fish may be transported from Lower Granite or subsequently from a downstream project as determined by the DART Transportation Filter.
- Lower Granite (Spillway Route): All juvenile detections at Lower Granite Spillway (GRS). Fish may be transported subsequently at a downstream project.
Result figures have been refined.
NEW. Hourly Adult Fishway Ladder Temperatures and Passage Counts. The DART Hourly Adult Fishway Ladder Temperatures and Passage Counts query generates plots and hourly detail tables for specific adult fishway ladders in the mainstem Columbia River and lower Snake River. The results include analysis of Differential Threshold exceedance based on user-specified settings for Ladder Differential and River Temperature.

UPDATED. Columbia Basin "Quick Look" Summer Water Temperature. Added current year adult passage counts for sockeye and steelhead at each project. Added historical run timing average for 10 years for adult passage at each location.

For example, without adjusting timestamps, the first juvenile Chinook detected at GRS after spill operations by observed clock time have commenced on "4/3/2020" are:
     tag_id     |      date_time      | obs_site | stage
----------------+---------------------+----------+-------
 3DD.003D3C4FD7 | 2020-04-02 23:20:19 | GRS      | J
 3DD.0077CBFD50 | 2020-04-02 23:20:40 | GRS      | J
 3DD.0077CBD93E | 2020-04-02 23:21:38 | GRS      | J
 3DD.003D3C08A1 | 2020-04-02 23:22:07 | GRS      | J
 3DD.003D3C1C15 | 2020-04-02 23:22:41 | GRS      | J
 3DD.0077CBE083 | 2020-04-02 23:23:10 | GRS      | J
 3DD.0077C44627 | 2020-04-02 23:23:29 | GRS      | J
 3DD.003D3C4F1E | 2020-04-02 23:25:50 | GRS      | J
 3DD.0077C30887 | 2020-04-02 23:27:45 | GRS      | J
 3DD.0077C33C21 | 2020-04-02 23:27:52 | GRS      | J
 3DD.0077DABFDA | 2020-04-02 23:28:11 | GRS      | J
 3DD.003D3C1834 | 2020-04-02 23:47:21 | GRS      | J
 3DD.003D3C063C | 2020-04-02 23:52:59 | GRS      | J
 3DD.0077CBDD50 | 2020-04-02 23:56:02 | GRS      | J
     tag_id     |        date_time       | obs_site | stage
----------------+------------------------+----------+-------
 3DD.003D3C4FD7 | 2020-04-03 00:20:19-07 | GRS      | J
 3DD.0077CBFD50 | 2020-04-03 00:20:40-07 | GRS      | J
 3DD.0077CBD93E | 2020-04-03 00:21:38-07 | GRS      | J
 3DD.003D3C08A1 | 2020-04-03 00:22:07-07 | GRS      | J
 3DD.003D3C1C15 | 2020-04-03 00:22:41-07 | GRS      | J
 3DD.0077CBE083 | 2020-04-03 00:23:10-07 | GRS      | J
 3DD.0077C44627 | 2020-04-03 00:23:29-07 | GRS      | J
 3DD.003D3C4F1E | 2020-04-03 00:25:50-07 | GRS      | J
 3DD.0077C30887 | 2020-04-03 00:27:45-07 | GRS      | J
 3DD.0077C33C21 | 2020-04-03 00:27:52-07 | GRS      | J
 3DD.0077DABFDA | 2020-04-03 00:28:11-07 | GRS      | J
 3DD.003D3C1834 | 2020-04-03 00:47:21-07 | GRS      | J
 3DD.003D3C063C | 2020-04-03 00:52:59-07 | GRS      | J
 3DD.0077CBDD50 | 2020-04-03 00:56:02-07 | GRS      | J
UPDATED. Hourly Water Quality Data query. HTML Table and CSV File both updated with timestamps for Pacific Time with daylight savings.
NEW. Columbia Basin "Quick Look" Summer Water Temperature. Presents daily average water temperature data June-September at Columbia River and Snake River forebay water quality monitor (WQM) sites with inseason forecast temperatures, highest observed (historical period) and historical mean with +/- 1 standard deviation (SD) for each location. Observed data is updated daily; inseason forecasts are updated weekly.

- integrated a MegaMenu for easier and more intuitive navigation,
- created general audience webpages (About section) to highlight what we do, and
- provided quick access to specialized tools for expert users.

We established a new DART-specific file_id convention to streamline our processes related to PIT-tagged fishes and PTAGIS tagging files. The DART-specific identifiers were needed because multiple release events can be included in a PTAGIS P4 tagging file, while DART analytical processes require unique release events.
DART provides a number of analysis tools that group fish by PTAGIS tagging file (file_id), expecting data from a single release event. The advent of PTAGIS P4 software in 2018, allows taggers to combine multiple release events in a single file. To maintain and improve the functionality of the DART tools, we have created unique release events from PTAGIS tagging files containing multiple release events. These unique release events are identified in DART using the original file_id with an additional extension of the format ".DART[N]" where N is an incremental integer representing each sorted unique event within the file. Uniqueness is determined using the sorted data columns of original file_id, coordinator, organization, marking method, release date, release site, release hydro-unit, release river kilometer, hatchery, capture method, stock, brood year, migration year, and session message.
E.g., WJB-2022-180-001.xml becomes 5 unique tagging "files" based on 5 release dates.
        (new) file_id       	 coord 	 org  	 mark_meth 	  rel_date*  	 rel_site
WJB-2022-180-001.xml.DART1  	 WJB   	 YINN 	 HAND      	 2022-06-29* 	 PRDFBY
WJB-2022-180-001.xml.DART2  	 WJB   	 YINN 	 HAND      	 2022-06-30* 	 PRDFBY
WJB-2022-180-001.xml.DART3  	 WJB   	 YINN 	 HAND      	 2022-07-05* 	 PRDFBY
WJB-2022-180-001.xml.DART4  	 WJB   	 YINN 	 HAND      	 2022-07-07* 	 PRDFBY
WJB-2022-180-001.xml.DART5  	 WJB   	 YINN 	 HAND      	 2022-07-11* 	 PRDFBY
*Non-unique entry in original tagging file
Tagging files that contain a single release event retain their original identifier in DART reporting.
N.B. The integers used to identify a unique event are not static and may change if a new file_id version uploaded to PTAGIS results in a changed sort order of the identified columns.
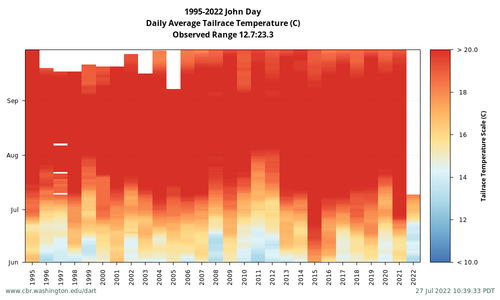
EXPANDED. New plotting options have been added to Columbia Basin Conditions single year and Columbia Basin Conditions All Years for Project
Plotting Options
- Heatmap Plot
- Heatmap Scale
- Autoscale (to data): Colors are scaled to data range.
- Range: Min and Max. Allowed: Min only, Max only, Min<Max. User can specify a Min, Max or Both. Min, all values below use one color; Max, all values above use one color.
- Heatmap Color Palette
- Default: Palettes selected by river data parameter.
- Cold->Hot (blue to red), Dry->Wet (brown to blue), Viridis Palette*, Plasma Palette*. *best for color vision deficiency and B/W printing.
- Heatmap Scale
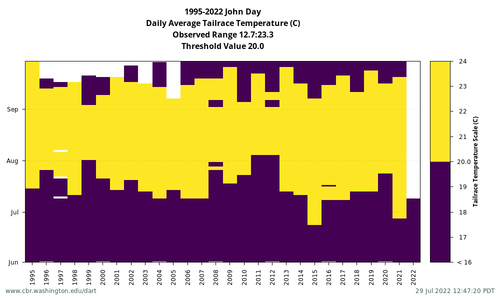
- Threshold Plot. Two color plot for above and below user-specified Threshold Value.
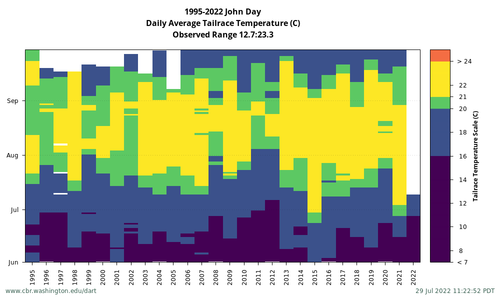
- Temperature Biologic (9, 16, 18, 20C) Plot. Five color plot: <9, 9-16, 16-18, 18-20, >20.
- Temperature Biologic Plus (16, 20, 21, 24C) Plot. Five color plot: <16, 16-20, 20-21, 21-24, >24.
- Gas Caps (110, 115, 120%) Plot. Four color plot: <110%, 110-115, 115-120, >120%.
- Gas Caps Plus (110, 115, 120, 125%) Plot. Five color plot: <110%, 110-115, 115-120, 120-125, >125%.
| Heatmap Autoscale, Default Palette | Heatmap Range Max set, Default Palette, Month Range set | Heatmap Range Min<Max set, Viridis Palette |

|
|

|
| Threshold Plot, Month Range set | Temperature Biologic Plus, Month Range set | Line Plot |
|
|

|
Announcement
Updates to the Acquisition of DART's Columbia Basin Hydrology Data
Historically, DART retrieved hourly and daily hydrology data from multiple sources published by USACE and PUDs to ensure timeliness and eliminate gaps in the data stream. This resulted in timestamping issues that eroded the utility of DART's hourly hydrology datasets. DART has revamped the acquisition of the hourly and daily hydrology data to resolve these timestamping issues. Now, DART's Columbia Basin hydrology time-series data are retrieved from the USACE CROHMS Dataquery 2.0 (DQ2) website with "PST" settings. This update provides a standardized source for historical and real-time data with consistent timestamping for hourly data, improving its utility for use in modeling and elucidating daylight savings transitions. Upper and lower bounds of data parameter values have been added to eliminate extreme outliers.
DQ2 itself has significant missing and erroneous data. We used DART's original historical records of Columbia Basin daily and hourly hydrology to repair these QA/QC issues, if possible. DART continues to use alternative sources, such as the CROHMS ftppub website, where DQ2 data gaps continue to be present in real-time data, (e.g., RIS & RRH barometric pressure, CWMW & HGHM data, and scroll case water temperatures). Timestamping is adjusted to match the DQ2 "PST" for these alternative sources.
All web-based hydrology data results are reported in US/Pacific "clock" time.
Please contact the DART Team dart@cbr.washington.edu for more information.
NEW. Columbia Basin "Quick Look" Spring Spill Chinook Fallback. Presents current and historical fallback rates during the Spring Spill Period at Snake River and Mainstem Columbia River projects. Fallback Rates are calculated using the DART PIT Tag Adult Fish Ladders Fallback analysis with data restricted to 4/3-6/20 at Snake River projects and 4/10-6/15 at Mainstem Columbia projects.

NEW. Added DART PIT Tag Adult Ladders -- Reach Distribution and Delay for Spring/Summer Chinook migrating upstream during the Spring Spill Period (4/3-6/20) at Lower Snake River reaches. The purpose of this tool is to report on reach travel time and highlight potential delay events in upstream migration for adult PIT-tagged Chinook during the spring spill period. Daily cohorts are created and tracked based on ascent success, and then reach travel time, percent arrival, and percent 'in route' are reported. Additional metrics are presented as well as comparisons to the adult visual count population.

NEW. Added DART PIT Tag Adult Fish Ladders Fallback for Bonneville (2006-), McNary (2006-), and Lower Granite (2016-) dams.

NEW. Added DART Columbia Basin ESU & DPS Smolt-to-Adult Return (SAR) Estimates for Snake River and Upper Columbia River ESU/DPS populations for multiple juvenile to adult reaches for 2000 to present. Analysis includes information on transportation.

NEW. Added DART PIT Tag Adult Returns Conversion Rate In-River/Transport Comparison for comparing in-river and transported fish based on the DART Transportation Filter.

UPDATED and EXPANDED. DART PIT Tag Adult Returns Conversion Rate
- Added Transportation Exclusion/Inclusion option to queries; default setting is to exclude transported fish. The DART Transportation Filter categorizes PTAGIS detection events as Transport, Sample or Bypass at Lower Granite, Little Goose, Lower Monumental, and McNary. Categorization is based on the last coil detection location and date within a project; timing and numbers of collection, bypass and transportation from the Smolt Transportation dataset (Fish Passage Center); and any subsequent downstream PIT-tag detections of individual fish. See DART Transportation Filter for further information.
- NEW. DART PIT Tag Adult Returns Conversion Rate Species, Run, Rear Type Comparison
- NEW. DART PIT Tag Adult Returns Conversion Rate Reach Comparison
- UPDATED. All graphics. Lower project arrival timing added to Annual Conversion Rates graph.


NEW. Columbia Basin Water Supply (updated monthly) presents current monthly water supply with historical and 30 year normal at select sites in the Columbia Basin: Columbia River at International Boundary, Priest Rapids, Dworshak, Lower Granite, The Dalles, and Bonneville. Based on April-September rankings at each site, the wettest and driest 5 years are highlighted. For complete coverage, please visit Water Supply Forecasts, Northwest River Forecast Center, NOAA.
UPDATED and EXPANDED. Columbia Basin Historical Run Timing with Temperature exposure for Adult Passage, ESU and DPS Passage for both Juvenile and Adult populations, PIT Tag Adult Passage, PIT Tag Juvenile Passage, and Smolt Passage. The user may select to view analysis for the past 10 to 25 years. Expanded analysis includes Historical Run Timing graph; Run Size with Middle 50% and 80% Duration graph; Historical Run Timing Regression graph; Water Temperature Exposure graph for first 25%, middle 50% and last 25% of run; Cumulative Passage graph; Daily Passage graph; and Migration Timing table with passage dates, run size, "today's" passage percent for individual years and averaged across all years, and links to water temperature exposure analysis for individual years.


NEW. Population Exposure Alerts for Observed and Forecasted Conditions for Snake River and Columbia River Mainstem Juvenile and Adults to TDG and temperature. Population Exposure Alerts is a web-based reporting tool that presents current and future water quality conditions, and it extends our real-time monitoring of juvenile and adult passage to assess if river conditions reach critical levels during the migration season. This tool presents observed exposure and our water quality forecasts with fish passage forecasts to predict the cumulative exposure of juvenile and adult salmon to TDG and temperature conditions. The tool supports RPA 15, 53, and 54 to assess the impact of passage conditions on juvenile and adult salmon migration and the effects of operations for juveniles on adult upstream migration.
EXPANDED. Columbia Basin Conditions for Temperature, Dissolved Gas Percent, Outflow, and Spill Percent (1995-present) including single year comparison to mean years and other years and all years seasonal trends.
- Basin Single Year: Daily conditions at Columbia Basin projects for a single year
- Basin Mean Year Comparison: Single Year comparison to N Year Average at Columbia Basin projects
- Basin Two Year Comparison: Single Year comparison to Single Year at Columbia Basin projects
- Project All Years Seasonal Comparison: Seasonal comparison across years for a Single Project
- Project All Years Historical Summary: History across years comparison for a Single Project
- Project Mean Year Comparison: Single Year comparison to N Year Average for a Single Project
- Project Two Year Comparison: Single Year comparison to Single Year for a Single Project
UPDATED. DART PIT Tag Adult Returns Conversion Rate. Detection Probabilities for general Snake River and Upper Columbia River populations at adult detection sites added to results.
NEW. Columbia Basin Conditions for Temperature, Dissolved Gas Percent, Outflow, and Spill Percent (1995-present) including single year comparison to mean years and other years and all years seasonal trends.

Public release of DART database to our new Linux / PostgreSQL system, which improves both the speed and reliability of the website services.
In March 2015, DART made publicly available our new Linux / PostgreSQL system. The migration of DART away from a 20 year legacy UNIX / Ingres environment has resulted in some changes to the underlying datasets used by DART for data publication and analysis. These changes are the result of two different processes.
For PTAGIS data, the restructuring of data tables to accommodate the completely available dataset from the primary source allows us to present the entire event dataset and synchronize on a daily basis. DART will now present the entire fish observation histories (versus first and last site detection) and provide better coverage of passage histories. This change in the underlying data may result in slightly different results for survival, travel time and conversion rate analyses as well as slight changes in DART’s life stage filter that assigns PTAGIS observations to juvenile and adult events.
For other datasets, the entire record was retrieved from the primary source. In some cases, this duplicates the data in DART’s previous version.
- For NOAA’s buoy data, PFEL’s upwelling indices, FPC’s Transportation numbers and Hatchery Release listings, the entire period of record was re-obtained from the primary sources and loaded into DART’s database.
- Hourly water quality and river environment data was transferred from the original DART database and is being updated daily from USACE online sources. There should be no changes observed in these datasets.
For a few datasets, the retrieval of the historical record has resulted in updates to a larger number of data rows.
- In particular, FPC’s complete smolt index dataset has been retrieved from FPC resulting in numerous changes to the data previously imported into DART via the “Two Week Passage Index” text files.
- The USACE adult passage data has also undergone a significant level of revision. The FCRPS adult passage counts were updated in their entirety (1938-2014) to reflect the daily numbers currently reported online by the US Army Corps Portland District.
For automated data retrieval with scripts, please contact us for help in updating your retrieval scripts. Any script using a URL referencing "/cgi-bin/dart" to retrieve data from DART will need to be updated.
New PTAGIS interrogation sites at The Dalles Dam Adult Fishways (TD1 and TD2) implemented throughout the DART PIT Tag reporting and analysis tools.
DART PIT Tag general reporting and analysis tools expanded to include all interrogation sites, where appropriate, including instream arrays.
Columbia Basin Quick Look basin-wide current conditions with 10 Year Averages for Adult Passage, Bonneville Spring Chinook, ESU Passage, Smolt Passage, River Environment updated daily.
Columbia Basin Research completely updated. Direct to CSV output format added to applicable DART queries. Option to Generate Data Link Only added to applicable DART queries for generating data retrieval code for scripts and automated processes.
NEW. DART Dataset Inventory presents dataset availability and year coverage in DART by location—includes individual monitoring sites within a project—for Adult Passage Visual Counts, PIT Tag Observations, PIT Tag Adult Returns, ESU/DPS Observations, Smolt Index, Transportation, River Environment, and Hourly Water Quality datasets.
ADDED. Graph for 4 Year Rolling Geometric Mean 50% Passage DOY to the DART Adult Passage Project Summary with Last Year, 4 Year Average, 10 Year Average, and Rolling Mean, Cumulative Passage, and Run Timing Graphs product.

The Pacific Northwest Index dataset, found on the DART Related Data and Topics web page, has been updated for 2011. Please consult the Pacific Northwest Index (PNI) web page for method descriptions.
The Spring Transition Dates and Fall Transition Dates dataset, found on the DART Related Data and Topics web page, has been updated for CBR Method Fall 2011 and Spring 2012. Please consult the Spring Transition Dates and Fall Transition Dates web page for method descriptions.
NEW. DART PIT Tag TagID List Analysis and Reporting offers DART analysis and reporting products for user-provided list of PTAGIS TagIDs. Currently, DART offers this process for generating Juvenile Survival and Travel Time Estimates. We will incorporate additional DART products as demand and time allows.
Added Valid Sample List download file to PIT Tag Adult Sampling and Tagging at Ladders output.
Adult Passage Annual Summary updated to calculate annual totals for specified date ranges separately for leap years and non-leap years. Previously, all years were treated the same, as non-leap years.
NEW. Bonneville Spring Chinook "Quick Look" with River Environment and Historical Run Timing. Updated daily.
DART is working closely with the ISEMP project and Washington Department of Fish and Wildlife to provide data queries for managers and scientists to access information associated with tributary PIT tag releases and subsequent tributary/mainstem detections. These queries are intended to assist a user to combine data from multiple detection types (recapture files, instream PIT detection sites, mainstem interrogation sites, etc.) and inform the user of the capture and migration histories, both in-basin and out-of-basin, allowing for more efficient/standardized analysis.
DART Columbia Basin Instream Arrays & Subbasins with Interrogation and Recapture datasets
- PIT Tag Subbasins - Tributary/Basin Release and Observation Summary and Detection Details with Interrogation and Recapture datasets
- PIT Tag Subbasins - Detection Site Observation Summary and Detection Details with Coil and Recapture datasets
- PIT Tag Subbasins - Interrogation Sites, Recapture Locations, and Year Ranges DART Fact Table
Researchers across the Columbia Basin have rapidly expanded efforts to deploy remote PIT tag detection arrays in tributary basins, providing an opportunity to observe movement and life history patterns of individual fish in greater detail. In order to standardize the efficient handling and analysis of these datasets for both juvenile and adult populations for specific research questions and to allow reproducible results across research studies, DART developed these web-based analytical processing tools fully aggregating the subbasin interrogation sites with recapture datasets. These tools provide detail and summary data for specific subbasins as well as metadata and methods for observation patterns, travel time statistics, straying, kelt migration, and ghost tag identification.
DART PIT Tag Adult Sampling and Tagging at Ladders Valid Sample List and Sample Time/Rates
The DART PIT Tag Adult Sampling and Tagging at Ladders, specifically Lower Granite Dam Ladder trap, allows users to identify PIT tagged fish associated the ISEMP steelhead and spring/summer Chinook salmon adult PIT tagging project. These tags are used to generate escapement estimates in tributary streams upstream of the detection location. Because the LGR Ladder trap has multiple users and objectives, it can be difficult to identify the PIT tags associated with the systematic sample due to trap operations (e.g. adult Sort-by-Code actions). The trap at Lower Granite Dam is computer controlled and systematically opens four times an hour at a specific rate (e.g. 10% of a 24 hour period). However, if a PIT tagged fish passing the trap is targeted for sampling associated with another project (Sort-by-Code), that fish could be collected outside the systematic sampling period. Since these SbyC fish are not a random sample (all sampling period and SbyC fish are collected in one box and trap personnel can not separate out when they were collected), they are not considered part of the tag list (Valid Sample List) used for upstream escapement calculations.
To ensure all users of the adult PIT tagging project have the same "Valid Sample List", DART created a query to identify all tagged and recaptured fish at the trap associated with the trap operations, and parse these fish into a real-time accessible list. Before this query, the list was created by hand and it was difficult to provide a list in a timely fashion to all cooperators and users, and ensure that users had the most up-to-date version.
Additionally, DART has created a query to summarize trap operations, specifically opening and closing times, total sample time by day, trap open times associated with the SbyC process, and the resulting numbers of recaptured fish collected by the sampling or SbyC process. From this information, the percent of time sampled can be calculated and used to inform the tributary escapement calculations.
4 Year Average passage to date calculations have been corrected in the Adult Passage Project Summary results to properly correspond to stated Chinook Run Date Ranges.
Last Year passage to date and 4 Year Average passage to date have been added to the Adult Passage Project Summary report summary table for all species counted in the current year at the select project. The summary table also includes cumulative passage to date, 10 Year Average passage to date, current passage percent of the 10 Year Average, run complete date. The summary table contains links to the 10 Year Run Timing graphs, Cumulative Passage with 10 Year Average graph, and 4 Year Rolling Mean graph.


On March 10, 2011, DART's Adult Passage dataset from the Army Corps dams--Bonneville, The Dalles, John Day, McNary, Ice Harbor, Lower Monumental, Little Goose, and Lower Granite--were updated in their entirety (1938-2011) to reflect the numbers currently reported by the US Army Corps, Portland District. The updates included replacement of manually entered data from printed reports, the inclusion of historical data previously missing from DART, and the correction of counts that have been updated. The 10 Year Averages have been updated.
New functionality implemented for the DART PIT Tag Adult Returns Conversion Rate Report to identify Chinook Minijacks in the results or exclude Chinook Minijacks from results. If Chinook Minijacks are not excluded, fish satisfying the criteria are identified in the detection details reports.
The new DART PIT Tag Release and Observation Summary with Tag File Selection query for Generating Survival and Travel Time Estimates allows for creating a more specific grouping of PIT Tag Releases for survival and travel time analyses based on release criteria--Release Year, Species, Run, Rear Type, Tag Coordinator and Release Location (either Release Basin or Release Site)--and user-specified Tag Files.
Lamprey counts from Bonneville Dam Lamprey Passage Systems (LPS) have been added to the DART Adult Passage dataset and suite of reports/tools. Unless specified otherwise, Lamprey is the combined count from the fish counting windows at Bonneville, reported daily. LPS is the count from the Lamprey Passage Systems (LPS) at Bonneville, reported approximately once a week, usually Wednesdays. The fish counting windows and LPS are mutually exclusive. LPS are located at Bradford Island, Washington Shore and Cascades Island. LPS were opened in 2009 and counting started in June 2010.
Adult Passage counts from Wanapum Dam for 2006 to the present, provided by Grant County PUD, have been added to the DART Adult Passage dataset.
The Spring Transition Dates and Fall Transition Dates dataset, found on the DART Related Data and Topics web page, has been updated for 2009. Please consult the Spring Transition Dates and Fall Transition Dates web page for method descriptions.
The Pacific Northwest Index dataset, found on the DART Related Data and Topics web page, has been updated for 2009. Please consult the Pacific Northwest Index (PNI) web page for method descriptions.
All Columbia Basin ESU (Evolutionarily Significant Unit) stock definitions have been updated to best match ESA Listing Pages, Protected Resources, NMFS, NOAA.
Columbia Basin Quick Look 2010 for Adult Passage, ESU Passage, Smolt Passage, and River Environment: 2010 basin-wide current conditions with 10 Year Averages.
Columbia River DART is now hosting Adult Anadromous Fish Radiotelemetry Project 1996-2004.
Release Basin RKM option added to DART PIT Tag Release and Observation Summary.
Cumulate Graph option added to all fish-based Graphics & Text reports: Adult Passage, Adult PIT Tag Returns, PIT Tag by Hydro Unit, PIT Tag by Observation Site, PIT Tag by Release Site, PIT Tag by Tag Coordinator, Smolt Index, Transportation, Trap Collected Counts, and Columbia Basin ESU.


Adult Steelhead Wild 10 Year Average and Adult Shad 10 Year Average added to the Adult Passage Graphics & Text report.
A new Adult Passage Project Summary report has been added to the DART Adult Passage suite of reports. The Project Summary report presents a summary table for all species counted in the current year at the select project including: cumulative passage to date, 10 Year Average passage to date, current passage percent of the 10 Year Average, run complete date. The summary table contains links to the 10 Year Run Timing graphs, Cumulative Passage with 10 Year Average graph, and a 4 Year Rolling Mean graph.

A new Report Year Type option has been added to composite and detail reports where appropriate. The Report Year Type option allows for the selection of Within Calendar Year (the default) or Span Calendar Years for a single year query. For example, to query an Adult Passage winter run, select Year as start year, enter Start Date and End Date, and select Span Calendar Years option. This functionality does not apply to the Graphics&Text queries.
The Pacific Northwest Index dataset, found on the DART Related Data and Topics web page, has been updated for 2008. Please consult the Pacific Northwest Index (PNI) web page for method descriptions.
Columbia Basin Quick Look 2009 for Adult Passage, ESU Passage, Smolt Passage, and River Environment: 2009 basin-wide current conditions with 10 Year Averages.
Columbia Basin ESU (Evolutionarily Significant Unit) reports and analysis tools expanded: Graphics&Text, One Week, Daily Summary, Summary&Migration Timing, Detail, Mean Travel Time, Run Timing, and Analyses. The Summary&Migrating Timing report includes the total observations to date for each component stock (Release Site, Species, Run, and Rear Type) at all projects in migration order with migration timing information for each project and linkages to river conditions during migration.
Adult Passage All Projects Summary report has been added. This report generates the Adult Visual Counts Summary for All Projects table, which includes the total visual counts for all monitored adult species at all projects for a selected year. In addition, the 10 Year Averages for Chinook, Jack Chinook, Steelhead, Sockeye and Coho are included in the table.
Adult Passage counts from Willamette Falls for 2001 to the present, provided by Oregon Department of Fish & Wildlife, have been added to the DART Adult Passage dataset. We expect to update this dataset as data is provided throughout the year.
Bonneville Dam Adult Passage counts for 1960, 1965, and 1966 were synchronized with the Annual fish passage reports of the U.S. Army Corps of Engineers, North Pacific Division.
The Spring Transition Dates and Fall Transition Dates dataset, found on the DART Related Data and Topics web page, has been updated for 2008 Spring Transition Dates. Please consult the Spring Transition Dates and Fall Transition Dates web page for method descriptions.
The Lamprey Adult Passage counts for 2004 at Wells Dam were reloaded with a corrected dataset provided by Douglas County PUD.
Adult PIT Tag Conversion Rate report has been expanded to include a summary graph of annual pooled Conversion Rates.
Release basin summaries and migration timing information have been added to the DART PIT Tags by Hydro Unit Summary, PIT Tags by Observation Site Summary, and PIT Tags by Tag Coordinator Summary report tools.
More than 15 PTAGIS detection sites have been added to all DART PIT Tag report tools.
Adult PIT Tag Conversion Rate detail report includes last juvenile detection site and detection date information.
The Pacific Northwest Index (PNI) dataset, a terrestrial climate index, found on the DART Related Data and Topics web page, has been updated for 1891-2007.
Adult PIT Tag Conversion Rate report has been expanded. We have added the option to include PTAGIS Recapture and Mortality datasets in the conversion rate calculations. Details on the expansion are covered in the Spring 2008 issue of the Salmon Insider, the Columbia Basin Research Newsletter.
The Spring Transition Dates and Fall Transition Dates dataset, found on the DART Related Data and Topics web page, has been updated for 2007 Fall Transition Dates. Please consult the Spring Transition Dates and Fall Transition Dates web page for method descriptions.
PTAGIS detection sites at John Day River RM 20 (JD1) and Trout Creek, Wind River (TRC) have been added to all DART PIT Tag Adult Returns report tools. Release basins for John Day River and Wind River have been added to the Conversion Rate, Observation Year and Run Timing PIT Tag Adult Returns report tools.
javaDART Applet for 2008 released.
DART Data Inventory query tools have been added for the Adult Passage Counts and River Environment datasets. Map-based DART Data Inventory is accessible from Google Maps at CBR.
Resident Species PIT Tag Summary report has been added. The report generates the Resident Species Release Summary table, which includes the Release Count for each Release Site by Species, Run, and Rear Type combinations for the selected Species and Release Year. The summary table also includes whether any of the PIT Tagged Resident fish were detected. Detection detail information is accessible from the query results for a particular Species, Run, Rear Type, and Release Site combination or for the Species.
Adult Passage counts from Tumwater Dam for 1999-2006, provided by Washington Department of Fish & Wildlife and Chelan PUD, have been added to the DART Adult Passage dataset. We expect to update this dataset as data is provided during the migration season. Adult passage data for Tumwater Dam is the combination of released counts, referring to fish passed upstream of the dam and allowed to spawn naturally, and collected counts, referring to fish retained for hatchery broodstock. The Chinook adult passage counts are the sum of hatchery spring, hatchery summer, wild spring, and wild summer chinook as reported. The Jack Chinook adult passage counts are the sum of hatchery spring, hatchery summer, wild spring, and wild summer jack chinook as reported.
The Spring Transition Dates and Fall Transition Dates dataset, found on the DART Related Data and Topics web page, has been updated to include both the OSCURS method (1946-1994) and Logerwell et al. method (1969-present). Please consult the Spring Transition Dates and Fall Transition Dates web page for method descriptions.
Ten Year Historical Run Timing reports for the Adult Passage, PIT Tag Adult Returns, PIT Tag Observations, Smolt Index, and Columbia Basin ESUs datasets are now available for the years 1997-2006.
DART River Environment queries are reporting the USACE's Recalibrated Spillway Discharge at Bonneville for 2002-2004. The Water Quality reports for BON, CWMW, CCIW, and WRNO include the recalibrated spill at Bonneville. The USACE initially reported incorrect hourly Bonneville spillway discharge for this period.
We have updated our graphics program to allow non-averaged data and 10 year average data to share the same Y-axis.
We have implemented a life stage filter as part of the queries found under the "PIT Tag Adult Returns" category on the DART web pages: Graphics&Text, Observation Year, Release Year, Observation Summary, Mean Travel Time, Run Timing, and Conversion Rate. The Adult PIT Tag observations presented in these reports are based on data filtering--including migration year, release year, release length, observation year, release site, and other criteria--used to determine the stage of the PIT-tagged fish at the time of the detection. DART categorizes PIT Tag observations into three stages: Adult, Juvenile, and Unknown. PIT Tag detections that DART has determined to be of Juvenile or Unknown stage are excluded from these PIT Tag Adult Returns reports.
Bonneville Power Administration has extended the contract for the Fish Passage Center through November 2006. Further information about this topic can be found at Bonneville Power Administration Newsroom (04/12/2006 release), The Columbia Basin Bulletin (04/14/2006), and NW Fishletter (04/18/2006 #213). FPC is the primary source for the Smolt Index, Hatchery Releases, and Transportation datasets in DART.
Ten Year Historical Run Timing reports developed and applied to the Adult Passage, PIT Tag Adult Returns, PIT Tag Observations, Smolt Index, and Columbia Basin ESUs datasets. Use the reports to view species or stock run timing and migration timing characteristics--which includes first, 1%, 5%, 10%, 50%, 90%, 95%, and last passage dates as well as the number of days for the middle 80% of the run--at a specific project for the last 10 years (1996-2005). The 10 Year Historical Run Timing reports allow the comparison of run timing across multiple years for a particular species or stock.
For all datasets, we have integrated the Report query option into the Graphics&Text query option. Select "View Data Table (MM/DD)" from the "Select Output Format" list on the query page to produce the same output as the Report query option.
The majority of Columbia Basin ESU passage reports for 2006 are active. The Arithmetic Mean Travel Time Estimates for juvenile and adult Columbia Basin ESU populations are active for 2006 as well.
DART Metadata & Glossaries web page provides access to the collection of metadata and glossary information available for datasets offered in the Columbia River DART (Data Access in Real Time) database. Dataset-specific Metadata & Glossary information are linked to each applicable query page.
Implemented the DART Data Feedback form for submitting data quality control issues to the DART Coordinator.
Adult PIT Tag Conversion Rate report has been further expanded. From the Conversion Rate Report output, you may select from several other report options to examine the data: Detection Details by Release Site, Detection Details by Age, Detection Details by Date, and Conversion Rates by Date. Detection details reports include release date, release site, release river km, last detection dates, reach travel time, and special conditions indicators for individual PIT Tag IDs and arithmetic and harmonic mean travel times for fish grouped by report category. Or you may click on a Release Site to view detection details for that particular release site within the year.
The majority of Columbia Basin ESU passage reports for 2005 are active. The Arithmetic Mean Travel Time Estimates for juvenile and adult Columbia Basin ESU populations are active for 2005 as well.
Adult PIT Tag Conversion Rate report has been expanded to include flags for special conditions (overwintering, tagged as adults, and multiple migrations) and links to detection detail reports for individual detection year by single release site, by all release sites, and by age.
javaDART version 2.0 is released as an applet to run in your web browser and as an application to download to your local system.
The 2005 Adult Passage counts reported by the primary agencies and made available in the DART database are approximately 1 week behind today's date. Most projects do not start daily reporting of adult passage data until April.
Fixed issue with Adult Passage Annual Summary report that was excluding data outside the spring, summer and fall migration seasons.
Upper Willamette River Spring Chinook ESU reports for 2005 are active.
Upgrade to the DART graphing program installed.
Updates to the majority of the detail and summary PIT Tag reports installed.
Adult Passage Annual Summary report has been added. The Annual Summary report includes total adult salmon passage counts for all adult species at a selected project for all years in the Columbia River DART database. The annual summary totals may be limited by a selected range of dates or by chinook run dates as defined by the USACE and YKFP.
Adult PIT Tag Conversion Rate report updated to include Month Range query selection.
Adult Passage data was synchronized with the adult passage data set available through the USACE Northwest Division's interactive database query system. At the same time, historical chinook run designations were re-assigned to match current run timings as defined by the USACE and YKFP.
javaDART 2.0 is a new Columbia River DART database access tool based on the java programming language. It runs within a web page as an applet giving users greater flexibility to extract and analyze data from DART in both graphical and text-based formats. javaDART provides access to the River Environment, Adult Passage, and Juvenile Passage data sets. Plotting multiple data types in a single graph is possible with javaDART, which supports up to four separate Y axes. Graphs can be configured with axis scaling options including zoom in and zoom out capabilities for each axis as well as a round axis function that uses an adaptive rounding algorithm to create readable axis value labels. Graphs may be saved or exported to number of popular formats or copied to the system clipboard. With the text data interface, users can specify which columns to be copied or saved to disk. The text view handles both Julian dates and a standard date format. javaDART data analysis functions include parameter versus parameter (XY) plots and linear regressions on data series pairs. Regression lines and statistics are displayed on the graphs. Data filtering algorithms are a powerful data analysis feature of javaDART that can identify and remove erroneous data that sometimes occur in data queries. The user can easily control the amount of filtering using a redesigned filtering interface with slider controls. In addition, javaDART offers data accumulation; histogram options by weeks, months, or years; and plotting multiple years consecutively or as individual years.
New version of the Survival and Mean Travel Time estimates program available from the PIT Tag Release and Observation Summary report has been installed. Analysis available for user-selected PIT Tag groups include Cormack/Jolly-Seber, arithmetic mean travel time, and harmonic mean travel time estimates.
PIT Tag Adult Returns Observation Summary report updated to include by Brood Year summary option.
DART initiated a daily ODBC connection to the Yakima-Klickitat Fisheries Project adult passage data for Prosser and Roza dams. This cooperative database endeavor ensures synchronicity between the two data sites and is an example of the possibilities for a regionally distributed database.
Columbia Basin ESU juvenile and adult data services expanded to include: Upper Columbia River Spring Chinook, Middle Columbia River Steelhead, Lower Columbia River Steelhead, and Upper Willamette River Spring Chinook.
Updated PIT Tag Release Sites on PIT Tag query pages.
Adult PIT Tag Conversion Rate report output updated to include overwintering information and separate conversion rate summaries for all years and all historical years in the query.
New version of the Survival and Mean Travel Time estimates program available from the PIT Tag Release and Observation Summary report has been installed. Analysis available for user-selected PIT Tag groups include Cormack/Jolly-Seber, arithmetic mean travel time, and harmonic mean travel time estimates.
Prosser and Roza dams adult passage data are now available from the Yakima Klickitat Fisheries Project. Currently, the data set is not updated daily.
2003 Adult Passage Counting Schedule: The near realtime data from visual counts has started.
2003 Adult Passage Counting Schedule: The 2003 data currently available in our database originates from USACE video recordings; the video counts are running approximately 1 week behind today's date. This year, the video counts are for a 16 hour period compared to only 8 hours in previous years.
New Adult PIT Tag Observation Sites -- BO3, IHA, PRA, and RIA -- have been added to the PIT Tag query pages.
Updated PIT Tag Release Sites on PIT Tag query pages.
Updated PIT Tag Release Sites on PIT Tag query pages.
DART provides two types of water temperature data. One is the scrollcase data taken from inside the project structure. The other is the water column temperatures observed at the Water Quality Monitoring (WQM) probes generally at about 15 feet deep in the forebays and tailraces of the projects. In the past, these two data sets were merged into one with pre-1995 data exclusively scrollcase and post-1994 data exclusively WQM. These two data sets are now separated. Both temperature data sets can be queried from the River Environment web pages: "Temperature (Scroll Case)" for scroll case and "Temperature (WQM)" for water quality monitor.
Adult Passage data at Bonneville added for 1938 - 1948.
The Smolt Index data set has been updated from the Fish Passage Center (primary source) for all years. The data set includes the individual rear types: Wild, Hatchery, and Unknown. From 2000 to the present, the only individual rear type in the data set is Unknown.
New Adult PIT Tag Observation Sites -- BO1, BO2, MC1, MC2, TMA, and WEA -- have been added to the PIT Tag query pages.
2002 Adult Passage Counting Schedule: The near realtime data from visual counts has started.
2002 Adult Passage Counting Schedule: The near realtime data from visual counts of adults at the Columbia Basin hydroelectric projects are officially scheduled to begin April 1, 2002. The 2002 data currently available in our database originates from USACE video recordings; the video counts are running approximately 1 week behind today's date.
A Location Map showing the majority of data collection locations contained in DART is now available. Go to Map.
A new PIT tag summary report, Release and Observation Summary, has been created to allow selection of specific or general release criteria and obtain a summary of the releases and observations that match.