javaDART Help
Introduction to javaDART
javaDART is the Columbia River DART database access tool that is based on Sun's java programming language. It is available as both an applet to be run in a web browser and an application to be run from a client computer. javaDART formulates queries to the Columbia River DART database and displays the results in either graphical or text-based formats. The tool includes the ability to save query/graph configurations to a favorites directory on the user's local computer to be accessed and updated with current data at a later date.
The javaDART tool offers many options not available through the classic web-based DART graphing program. Plotting multiple data unit types in one graph is possible with support for up to four different Y axes on the same graph. The tool offers several axis scaling options including zoom in and zoom out capabilities for each graph axis as well as a round axis function that uses an adaptive rounding algorithm to create readable axis value labels. The tool also includes Undo and Redo capabilities for backing up changes. In addition, javaDART includes multiple histogram options for accumulating data over weekly, monthly, or yearly intervals.
Graphs may be saved or exported to either JPEG or PNG formats, or the image may be copied to the system clipboard. The text data interface allows the user to specify which columns are to be copied or saved to disk. The text view handles Julian dates (day of year) and standard date (month/day/year) formats.
javaDART is capable of many data analysis functions, including parameter vs. parameter plots for number of data series pairs (XY Plot). It is possible to calculate and graph the linear regression equations for these plots. The data filtering algorithms can account for the erroneous data, which sometimes show up in queries. The user can easily control the amount of filtering using the filtering interface with slider controls.
Online help is available from anywhere in the program; the help system has been designed to cover all of javaDART's capabilities. Step by step tutorials are included in the help system to assist users with learning about its features. Tool tips are also included as a context-sensitive guide to javaDART.
The user interface for javaDART was redesigned as part of an undergraduate research project in User Interface Design. javaDART is designed to maximize the effectiveness of Human Computer Interaction. The interface provides an intuitive and user friendly approach to database access and data analysis. User tasks have been simplified by shortening the number of steps to complete them.
Getting Started with javaDART
Key Concepts
There are several key concepts used by javaDART and are referred to throughout the Help System.
- Graph Type - Graph Type determines which database query selections are available and controls the Parameters, Years, and Projects and Locations lists. Database queries and results are organized by Graph Type within javaDART. See Graph Type section for more details.
- Selection Object (SO) - A Selection Object (SO) is the data structure that contains all of the information needed to query data from the Columbia River DART database and display the results in a Graph Window. Information contained in a SO includes Graph Type, query parameters, range of years, location, plot colors and symbols, data filtering, graph labels, etc. See Selection Objects section for more details.
- Graph Window (GW) - A Graph Window (GW) is the window that controls, modifies, and displays the query results in either graphic or text formats. Advanced data analysis features and viewing options are accessed through the Graph Window. See Graph Windows section for more details.
User Interface
The user interface of javaDART is composed of multiple areas. The elements of the User Interface, basically clockwise from the upper-left corner, are:
- Graph Type buttons (see Graph Type section)
- Selection lists: Parameters, Years, Projects and Locations
- XY Plot checkbox
- Create button
- Graph Management list
- Update button
- Delete button
- Help button
- About button
- Favorites List

javaDART User Interface
Selection Lists
The Selection lists--Parameters, Years, Projects and Locations--provide the initial point to select data to be queried and viewed. When initially accessing javaDART, all Selection lists will be empty. The three lists are populated with Graph Type specific choices after clicking on one of the three Graph Type options. To select multiple items from any selection list, hold down the Control key and click the items. The default graph produced by selecting multiple years, not necessarily consecutive, from the Years selection list will span from the earliest year selected to the latest year selected. Note: A single year in brackets following the location/project indicates the earliest data available in the DART database for the selected Graph Type. A range of years in brackets indicates an historic data set rather than a real time data set in DART.
Once the desired parameters, years and locations have been selected, clicking the Create button will generate a new Graph Window. The new graph will be added to the Graph Management list for the current Graph Type, e.g., Adult Passage. Any number of graphs can be created using this process. Each new graph of the same Graph Type will be added to the end of the graph list.

Selection lists populated with Adult Passage Graph Type elements
XY Plot
The XY Plot checkbox controls whether to initially graph two data parameters against each other or against time. The XY Plot checkbox option, in the main window, requires that exactly two elements be selected from the Parameters list; however, any number of Years and Locations may be selected. Multiple XY plots will be graphed in different colors, one for each location. The XY Plot option graphs one data point for each day that both selected Parameters have valid data. Tutorial 4 demonstrates how to create a XY Plot for two locations against each other. (See the Graph Menu section for more details.)
Create
After selecting the desired Graph Type and making selections from the Selection lists, click the Create button to query the DART database and view the resulting graph.
Graph Management
The Graph Management list contains the list of currently open Graph Windows for the selected Graph Type, e.g., Adult Passage. Each open Graph Window is listed in the Graph Management list, with a naming convention corresponding to the selection parameters contained within the graphs. Once a graph is highlighted in the management list, the options in the Selection lists will change to the selected graph's current configuration. It is possible to change these parameters by modifying the selections and clicking the Update button; the corresponding graph will change to reflect the newly selected parameters. Graphs may also be deleted from this list by highlighting the graph in management list and clicking on the Delete button. Exiting the Graph Window by either clicking on the X or selecting File / Close will remove the graph from the list.

Graph Management list of open Adult Passage Graph Type windows
Update
The Update button modifies a highlighted graph in the Graph Management list based on selections in the Parameters, Years, and Locations lists. To modify a current graph:
- Highlight the graph in the Graph Management list. This action highlights the currently selected options from the Parameters, Years, and Locations lists.
- Add or delete selections from the Parameters, Years, and Locations lists as desired.
- Click the Update button to query the DART database with the modified selections and view the resulting updated graph or text columns.
Delete
Clicking on the Delete button removes a highlighted graph from the Graph Management list and closes the Graph Window.
Help
Clicking on the Help button opens the javaDART Help System.
About
Clicking on the About button displays the brief javaDART "about" statement.
Favorites List
The Favorites List drop-down menu provides quick access to graph configurations that have been previously saved to the local disk. Click on the Browse button to configure the applet session for the location the Favorites directory, a directory containing saved graph configuration files (.gcf), on the local computer. During the install process for the application version of javaDART, a "DARTFavorites" directory is placed in the install directory. To add a favorite, save the graph configuration to the defined Favorites directory using the File / Save As ... option.

Favorites List and Browse button
Graph Type
The use of javaDART is controlled by the three Graph Type buttons found in the initial startup window: River Environment, Adult Passage, and Juvenile Passage.
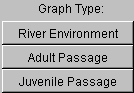
Graph Type buttons
The three Graph Type options determine the data sets and options available to choose from. The Parameters, Years, and Projects and Locations lists are populated depending on the selection made for Graph Type. Not all parameters and years listed for each Graph Type are available at each project/location. Both Adult Passage and Juvenile Passage include the option of plotting River Environment data for the same locations available for plotting fish species. For each Graph Type option, the years that data are available are location-specific. The first year that data are available at a particular location is listed in brackets following the location name.
River Environment
The River Environment Graph Type allows the user to select data pertaining to physical parameters of the river including outflow, spill, dissolved gas, dissolved gas percent, barometric pressure, temperature, and turbidity. Daily data are collected at most major Columbia and Snake River dams as well as tailrace and other monitoring locations throughout the basin. This graph choice does not allow for graphing of fish data. Data are available from 1949 to the present. The River Environment data are courtesy of U.S. Army Corps of Engineers, NWD (http://www.nwd.usace.army.mil/) and Grant County PUD (http://www.gcpud.org/).
Adult Passage
The Adult Passage Graph Type allows the user to select data pertaining to the counts of adult salmonids at most major Columbia and Snake River dams. Daily adult passage counts are collected at the fish ladders located at the major dams during the fish migration season. This graph type allows the user to combine the Adult Passage data set with the River Environment data set by location and by year. Data are available from 1938 to the present. The Adult Passage data are courtesy of U.S. Army Corps of Engineers, NWD (http://www.nwd.usace.army.mil/), Chelan County PUD (http://www.chelanpud.org/), Douglas County PUD (http://www.douglaspud.org/), Grant County PUD (http://www.gcpud.org/), and Yakima Klickitat Fisheries Project (http://www.ykfp.org/).
Juvenile Passage
The Juvenile Passage Graph Type allows the user to select data pertaining to juvenile salmonid passage index and collection counts at locations throughout the Columbia Basin. Data collection locations include dams and river traps along the Salmon, Snake, Columbia, Imnaha and Grande Ronde rivers. This graph type allows the user to combine the Juvenile Passage data set with the River Environment data set by location and by year. Data are available from 1985 to the present; the distinction between wild and hatchery fish is only available for 1985 through 1999. The Juvenile Passage data are courtesy of Fish Passage Center (http://www.fpc.org/).
Selection Objects
A Selection Object (SO) is a data structure that contains all of the information needed to retrieve data from the Columbia River DART database and display it in a Graph Window. The information needed to retrieve data from the database includes the type of information, a range of years, and the location at which the data was gathered. For instance, one such set might be "water temperature, from 1995 to 1999, at Bonneville Dam." The information needed to display that data includes the color and decoration/symbol, a id and an abbreviated name, whether the drawn line should be highlighted, and data filtration parameters. The user can also control whether the data in a given SO is summed or averaged if it is displayed in histogram mode, and whether the data displayed is accumulated.
Conceptually, a SO does not include the data itself, but only the recipe for obtaining and displaying the data.
The data selected by a SO is a scalar value per calendar day; data values may be missing. The data type of a SO is immutable, but all other parameters can be modified. Once a Water Temperature SO is created, it will always select Water Temperature data; however, the user can modify it or add to it to select that data from a different location or a different span of years, etc.
See the Customize Dialog section for detailed information about customization options.

Customize Selection Object dialog from Graph / Data Management... / Customize...
Graph Windows
A Graph Window (GW) contains a collection of Selection Objects (SOs) and displays them in either graphic or text format. A GW has several options for displaying data that are controlled from the Menu Toolbar at the top of the GW. A GW may contain up to four data axes that each contain a list of SOs (data units required to be compatible).
In the default mode, data versus time, there is a common X-axis that denotes time and data values are plotted on the Y axes. The X-axis spans the maximum
span of years of all the SOs in any of the data axes that are currently being displayed (unless Graph / Over Plot Years is selected).
The X-axis can be zoomed and panned with the X Axis Toolbar. Each data axis that is being displayed has a Y Axis Toolbar at the top of the Graph Window that controls scaling. Each Y-axis can be shown or hidden independently (Graph / Data Management...). The data in each
SO is drawn as a line with the desired color and decoration (Graph / Data Management... / Customize...). The line can
either be connect-the-dots or cityscape, as selected by the ![]() toggle button in the toolbar. Dashed lines are drawn across spans of missing data to connect actual
data points.
toggle button in the toolbar. Dashed lines are drawn across spans of missing data to connect actual
data points.
In the XY Plot mode, parameter versus parameter, there are two "data" axes: Left and Bottom. Each data axis has a "Y Axis" toolbar to control scaling. See the Graph Menu section for more details on XY Plots.

Graph Window (GW) with four Y-axes, dashed lines for missing data, and X-axis zoom
Menu Toolbar
Save and print options are accessible from the File menu. Edit and copy options are accessible from the Edit menu. Display options are accessible from the View menu, e.g., View as Text, Grid. Data customization, filtering, and management options are available from the Graph menu, e.g., Over Plot Years, Linear Regression, and Histogram.
X Axis Toolbar
Each GW contains one X axis and one X Axis Toolbar. See the X Axis Toolbar section for details.
Y Axis Toolbar
Each GW may contain up to four Y axes and contains one Y Axis Toolbar for each visible Y axis. See the Y Axis Toolbar section for details.
Mouse Functions
There are several functions that are controlled by moving or clicking the mouse in specially defined areas within the Graph Window. Axis coordinates are tracked and displayed in the respective toolbar areas (to the right of the XMax and each YMax text input box) as the mouse is moved over the plot. A left or right mouse click on data text labels within the GW activates specially defined display functions.
Left-click-drag
Graph Windows may be resized in the standard window manner. Move the mouse pointer over one of the four corners of the window until the pointer changes to a double-headed arrow and then click-drag the window corner to the desired size. The plot will be redrawn to maximize the available space in the newly resized window.
Left-click
Individual SOs may be highlighted within a plot by left-clicking the mouse on the data text label in the axis key area below the plot. Left-clicking on the "ChinA,BON,01" text label toggles between the data displaying in default format (no highlight) and being highlighted (thick plot line/decoration). Highlighting can be specified from the Graph / Data Management... / Customize... dialog.

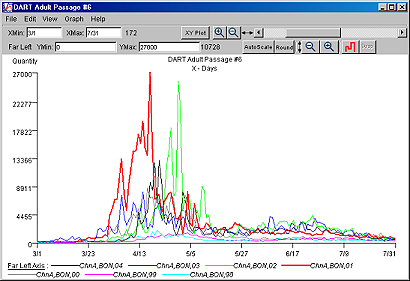
Graph Window (GW) with no highlights and with 2001 highlighted (thick red plot line)
Right-click
Individual SOs may have data filtering turned off and on within a plot by right-clicking the mouse on the data text label in the axis key area below the plot. Right-clicking on the "WTmp,PRD,96" text label toggles between no data filtering being applied to the SO (data text label in plain font) and applying the defined data filtering algorithm to the SO (data text label in italic font). Data filtering is defined from the Graph / Data Management... / Data Filter... dialog.

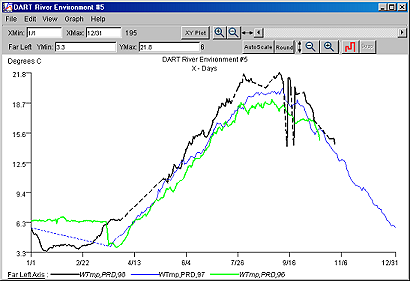
Graph Window (GW) with Data Filtering Off (data text label in plain font) and with Data Filtering On (data text label in italic font)
X Axis Toolbar
The X Axis Toolbar controls the range of dates for the data being displayed. The X Axis Toolbar is one of two types of axis toolbars; the other axis toolbar is the Y Axis Toolbar or data axis toolbar. The X Axis Toolbar is displayed at the top of each GW in every display mode. In the default mode, data versus time, there is a common X-axis that denotes time. The X-axis spans the maximum span of years of all the Selection Objects (SOs) in any of the data axes that are currently being displayed. If Graph / Over Plot Years is selected, then only one "year" is represented on the X-axis and data is displayed by day-of-year within each year.

X Axis Toolbar using zoom in function and displaying current X position (March 6, 2004)
Text Input Boxes
The XMin and XMax text input boxes contain the first and last dates currently being displayed. The user can modify the date range by typing new values in the following date formats:
- MM/DD/YYYY format,
- as a single number, which is taken as an integer number of days from the beginning of the year span (1-366),
- WW/YY in Weekly Histogram mode,
- MM/YY in Monthly Histogram mode, or
- YYYY in Yearly Histogram mode.
Pressing Enter/Return will activate these changes.
X Coordinate Tracking
As the mouse is moved over the plot, X-axis coordinates are tracked and displayed to the right of the XMax text input box. In the default display mode, the X-axis coordinate is displayed in date format 1 (MM/DD/YYYY). The X-axis coordinates may be displayed in the other four date formats depending on display mode, selection of Julian Dates or Standard Dates in View / Text View Options, and selection of Histogram mode in Graph / Hist. Options.
XY Plot
The XY Plot button toggles the XY Plot display mode. See the Graph Menu section for more details about XY Plots.
Zoom and Pan
The zoom in ![]() and zoom out
and zoom out ![]() buttons shrink or expand the time scale for the currently viewed data. The
buttons shrink or expand the time scale for the currently viewed data. The ![]() button zooms in, by making the minimum and
maximum dates be closer together, to display less of the available span. The
button zooms in, by making the minimum and
maximum dates be closer together, to display less of the available span. The ![]() button
zooms out, by making the minimum and maximum dates be further apart, to display
more of the available span. The
scrollbar allows the user to pan the graph from side to side while maintaining
the given degree of zoom.
button
zooms out, by making the minimum and maximum dates be further apart, to display
more of the available span. The
scrollbar allows the user to pan the graph from side to side while maintaining
the given degree of zoom.
Y Axis Toolbar
The Y Axis Toolbar controls scaling for the data being displayed. The Y Axis Toolbar is one of two types of axis toolbars; the other axis toolbar is the X Axis Toolbar or time axis toolbar.
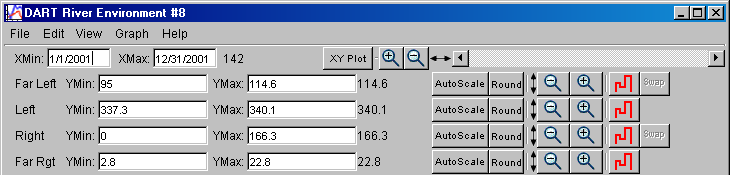
Y Axis Toolbar using Round feature on one axis and displaying current Y position for both
In the default mode, data versus time, there are four data axes named Far Left, Left, Right, and Far Right. There is a separate Y Axis Toolbar at the top of each GW for each data axis that is currently being displayed. The axes currently being displayed are determined by the original query selections and can be hidden and contents be modified from the Graph / Data Management dialog.
Text Input Boxes
The YMin and YMax text input boxes allow the user to enter values to directly control the vertical scale of the display. Note that the vertical scale is controlled separately for each axis. By default, each axis is set to autoscale, and the YMin and YMax values are the minimum and maximum values for any valid data in any SO associated with that axis. The user can modify the data range by typing new values in the minimum and maximum input boxes. The format is constrained by the Precision setting for each data axis in the Edit / Labels... dialog. The default Precision setting is "1" or one decimal place. A Precision value of "0" will constrain the allowable inputs values to integers.
Y Coordinate Tracking
As the mouse is moved over the plot, Y-axis coordinates are tracked and displayed to the right of each YMax text input box. In the default display mode, the Y-axis coordinate is displayed as an integer to the first decimal place. Decimal precision of the tracking value can be specified in the Edit / Labels... dialog.
AutoScale
The AutoScale button scales the individual Y-axis to the minimum and maximum values for all valid data associated with that axis independent of X axis scaling. This is the default mode for scaling the data axes.
Round
The Round button, when activated (pushed in state), forces the YMin and YMax values to be round values. Round values are defined as a single non-zero digit followed by any number of zeros. Deactivating the Round button will restore the zoom aspect to the original (autoscale) values.
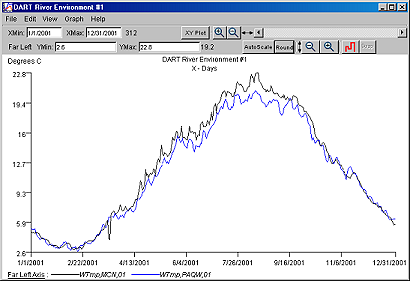
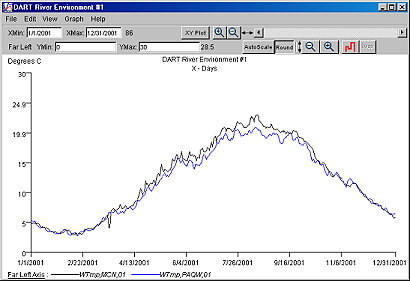
Graph Window (GW) with default scaling and with Round scaling
Zoom
The Y Axis Toolbar zoom in ![]() and zoom out
and zoom out ![]() buttons shrink or expand the vertical scale for the currently viewed data. The zoom out
buttons shrink or expand the vertical scale for the currently viewed data. The zoom out ![]() button will increase
the viewing scale to twice its current scale. The zoom in
button will increase
the viewing scale to twice its current scale. The zoom in ![]() button will decrease
the viewing scale to half its current scale.
button will decrease
the viewing scale to half its current scale.
Cityscape
The cityscape ![]() button on a Y Axis Toolbar controls the method of drawing lines to
connect data points in the data versus time line-drawing mode. When the button is in the
pulled-out state (default), the lines will be drawn straight from one data
point to the next. When the button is in the pushed-in state, the data points
will be connected with horizontal and vertical line segments, only, giving a
"cityscape" appearance.
button on a Y Axis Toolbar controls the method of drawing lines to
connect data points in the data versus time line-drawing mode. When the button is in the
pulled-out state (default), the lines will be drawn straight from one data
point to the next. When the button is in the pushed-in state, the data points
will be connected with horizontal and vertical line segments, only, giving a
"cityscape" appearance.
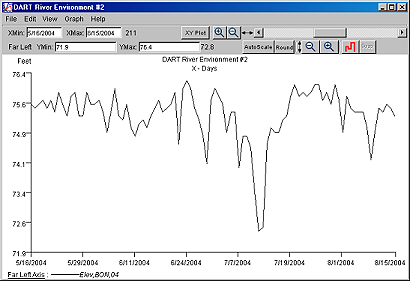
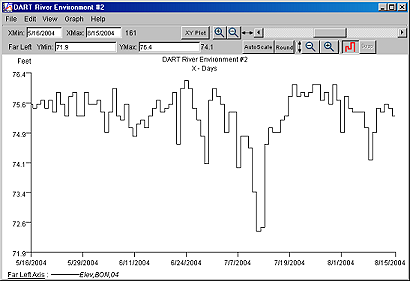
Graph Window (GW) with default line-drawing mode and with cityscape drawing mode
Swap
The Swap button will transpose paired data axes for XY Plots only.

Graph Window (GW) XY Plot default display and XY Plot using data axes Swap
File Menu
Open...
The File / Open... option opens a GW configuration file (*.gcf) saved on
the local disk. The keyboard shortcut for this action is Ctrl + O.
Save As...
The File / Save As... option stores the complete GW configuration (*.gcf)
in a file on the local file system. What is stored is the scaling and
display option settings and the complete list of Selection Objects. The actual data being
displayed is not stored, but the entire recipe needed to recreate a graphical or text
display is stored. The GW configuration file allows users to customize a given GW, then store that
work so that it can be quickly recovered later. The user might put a lot of
effort into getting a graph window to show exactly the desired data, and then save
that configuration. At any later time, the user can access that configuration
with File / Open... and immediately see the same complex graph
recreated with data newly retrieved from the Columbia River DART
database. The keyboard shortcut for this action is Ctrl + S. Note: If you have established your Favorites List directory using the Browse button from the User Interface during an applet session, then saving a *.gcf to this directory automatically updates the Favorites List menu to include this
new choice (see Getting Started for details).
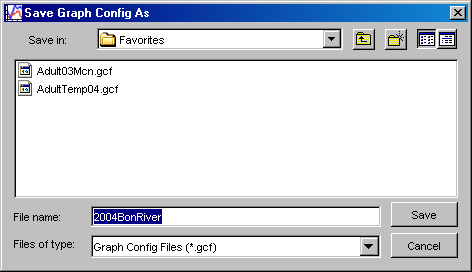
File / Save As... dialog
Save Data As...
The File / Save Data As... option saves the currently displayed data (in either graphic or text form) as tab delimited columns of text in a file on the local system. Use the View / Text View Options to specify whether missing data is represented with a space or the string "NA" and to specify the date format.
Save Image As...
The File / Save Image As... option saves the currently displayed data (in either graphic or text form) as a JPEG or PNG formatted image file on the local system.
Print...
The File / Print... option opens a printer control dialog to print the
current graph or text. The keyboard shortcut for this action is Ctrl + P. Note: The graph will be maximized to fix
the paper size and orientation.
Close
The File / Close option closes currently active GW. This action removes the graph from the Graph Management list. The keyboard shortcut for this action is Ctrl + W.
Edit Menu
Undo
The Edit / Undo option reverses the last change made to the GW view.
Multiple actions can be undone in the order from the most recent to earliest action. The keyboard shortcut for this action is Ctrl + Z.
Redo
The Edit / Redo option reverses the effects of the last Undo action completed.
Multiple actions ran be redone in the order they were originally done. The keyboard shortcut for this action is Ctrl + Y.
Copy
If viewing graphics, the Edit / Copy option copies the currently active graph to the system clipboard in image form. If viewing text, the Edit / Copy option copies the
currently selected columns to the system clipboard in tab delimited form. The text
can then be pasted into word processing or spreadsheet programs. The keyboard shortcut for this action is Ctrl + C. Note: Depending
on user-specifications set under View / Text View Options, data that are either missing from the database or flagged
as missing because of data filtration (see Data Filtering) are represented by a blank space or as the text string "NA".
Select All
The Edit / Select All option highlights all columns in the active Text View window. It only applies when viewing text (View / View as Text is selected). You can then use Edit / Copy to copy the highlighted text to the system clipboard. The keyboard shortcut for this action is Ctrl + A. Note: If the current mouse focus is in the XMin or XMax (Date) text input box, you will need to click on a single cell in the Text View to change the focus in order to use the keyboard shortcut.
Labels...
The Edit / Labels... option opens the Edit Graph Labels dialog to edit the Main Label (text in title bar of GW and graph title) and labels for each axis. The setting for Precision controls the numerical precision of the displayed Y axis values, the allowable entries for modifying the range in the minimum and maximum text input boxes, and the display of the Y-axis coordinates as the mouse is tracked over the plot. The default Precision setting for river condition parameters is "1" or one decimal place. The default Precision setting for fish passage is "0". A Precision value of "0" will constrain the allowable inputs and display values to integers.
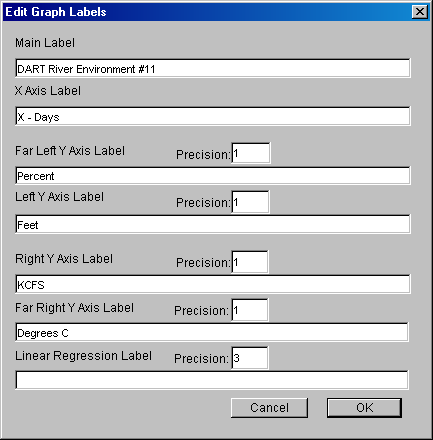
Edit / Labels... dialog
View Menu
View Options >
Grid
The View / View Options / Grid option turns on and off the display of a grid in the GW. The default setting is OFF.
Color
The View / View Options / Color option draws data lines using the defined colors in javaDART when turned on, or draws all data lines using black when turned off. The default setting is ON.
Decoration
The View / View Options / Decoration option turns on and off the display of plot symbols (square, cross, circle, etc.) on the graph to differentiate between data elements. The default setting is ON.
View As Text
The View / View As Text option toggles the data display mode between graphic (off) and text format (on). The default setting is OFF.
In text mode, a text view of data columns is shown. The
columns are ordered by date followed by columns for data selected by
a given SO. All of the SOs for the Far Left axis are
shown, followed by the Left axis, the Right axis, and the Far Right axis. When using the File / Save Data As... or the Edit / Copy options, the data columns are
tab delimited. The data columns can be selected by clicking the mouse on a single column, holding the Control key while clicking the mouse on the desired individual columns, or click-dragging the mouse over multiple consecutive columns. All columns of data can be selected by using
the Edit / Select All option. The Edit / Copy option
can be used to copy the highlighted columns to the system clipboard. Note: All rows of a column are selected. In order to limit the date range of the selected data, you must modify the date range of data using the XMin and XMax text input boxes or zoom options.
Text View Window
Text View Options >
Missing Data: Space
The View / Text View Options / Missing Data: Space option represents missing data values with a space in Text View mode and when using the File / Save Data As... option. This setting is recommended for exporting/saving data for use with spreadsheet applications like Excel. The default setting is OFF.
Missing Data: NA
The View / Text View Options / Missing Data: Space option represents missing data values with the text string "NA" in Text View mode and when using the File / Save Data As... option. This setting is recommended for exporting/saving data for use with statistical applications like S-Plus. The default setting is ON.
Julian Dates
The View / Text View Options / Julian Dates option renders dates in two columns: the first column is year and the second column is the day of year. This option is selected by default. Note: If Graph / Over Plot Years option is selected (default is OFF), then the Year column is a placeholder and each year of data is displayed as an individual data column.
Standard Dates
The View / Text View Options / Standard Dates option renders dates in a standard MM/DD/YYYY date format in a single Date column of the Text View mode. Note: If Graph / Over Plot Years option is selected (default is OFF), then the Date column contains MM/DD and each year of data is displayed as a separate data column.
Graph Menu
Cumulative
When a GW is in Y-T (data versus time, the default mode), XY Plot, or Text View mode, the data in individual Selection Objects may be set to be cumulative (default is OFF). This option will toggle accumulation for the entire graph. This setting may be turned on and off for individual SOs using the Graph / Data Management... / Customize... dialog; this is the same dialog where a SOs parameters may be modified as well. When accumulation is selected, the value displayed in any day is the sum of all valid data in that SO from the left edge of the display to the given day (in other words, accumulation respects the X-axis).

Steelhead Adult Passage Accumulation at Lower Granite for 1998 through 2004 for the period July 2 through December 31
Linear Regression
The Graph / Linear Regression option can be selected when viewing a XY Plot. The linear regression algorithm will determine the least squares fit line and draw it on the GW. The line's equation will also be displayed. Only points that are visible in the current GW will be considered part of the regression. The default setting is OFF.

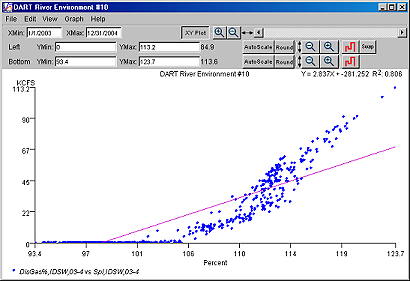
XY Plot with Linear Regression Line
Over Plot Years
The Graph / Over Plot Years option plots data for multiple years against each other with a common X-axis, which consists of 366 days. Data from all selected years are plotted within that day of year range, the year value being ignored. Only the first 366 data values in each SO are eligible for display. If the current graph contains SOs with multiple years, it will split them into individual years. The X-axis can still be zoomed in and panned, but can only zoom out to show 366 days. The default display for multiple years of data is to graph the dates consecutively from the earliest date to latest date of data. This option is available for all display modes except XY Plot. The default setting is OFF. Note: If turning Graph / Over Plot Years off, all SOs with consecutive years will be rejoined into multi-year SOs.

Graph Window (GW) with consecutive years and Over Plot Years turned on
XY Plot
When the Graph / XY Plot option is turned on, then two parameters (from the Parameters list) are graphed against each other not against time. The default setting is OFF.
In XY Plot mode, the four data axes are renamed: Left becomes Bottom, Far Left becomes Left, Right stays as it is, and Far Right becomes Top. There is no time axis as such. The axes are paired: Left pairs with Bottom and Right pairs with Top. Within each pair of axes, SOs are paired by reading down the lists in parallel: the first SO owned by the Left axis is paired with the first SO owned by the Bottom axis, the second Left SO is paired with the second Bottom SO, and so on. Within each pair of SOs, data points are paired similarly: the first Y data point is paired with the first X data point by date (either day of year or MM/DD), the second with the second, and so on. This allows data from different years to be paired, if desired. Assuming that both data points in a pair actually exist and are within the date range specified in the X Axis Toolbar, a point is plotted using the scale values of the two axes and the color and decoration of the SO contributing the Y value for the point. Paired data axes may be swapped using the Swap button found in the Y Axis Toolbar.
Graph Window (GW) XY Plot default display and using data axes Swap button
To learn more about creating XY Plots, please refer to the Tutorials section.
- Tutorial 3 - XY Plot with Graph Image Export
- Tutorial 4 - Plotting Parameters at Two Locations against Each Other
Histogram
The Graph / Histogram option toggles the display between the default mode and a histogram mode based on selections made in the Graph / Hist. Options submenu. The default setting is OFF.
In Histogram mode, the GW still displays an X-axis (time) and up to four Y axes (data). The data is aggregated over weekly, monthly, or yearly intervals. The data in each aggregate are either summed or averaged depending on user preference as selected in Graph / Hist. Options. By default, passage data are summed and river environment data are averaged. The data are then displayed by drawing vertical bars from the X-axis to the data Y values. The bars are shown in the color and with the decoration selected (Graph / Data Management... / Customize...).
javaDART considers every year to have 366 days, but in 3 out of every 4 years, Feb 29 will have only missing data. Summation over weeks, months, or years is handled correctly; the definition of weeks and months vary depending on the year. Also note, in weekly accumulation under histogram mode, the first week is always Jan 1 - Jan 7, the second week is always Jan 8 - Jan 14, and so on. javaDART has no concept of days of the week.
Hist. Options >
Weekly
The Graph / Hist. Options / Weekly option aggregates the data over weekly intervals. The default setting is ON.
Monthly
The Graph / Hist. Options / Monthly option aggregates the data over monthly intervals. The default setting is OFF.
Yearly
The Graph / Hist. Options / Yearly option aggregates the data over yearly intervals. The default setting is OFF.
Side by Side
The Graph / Hist. Options / Side by Side option specifies that the bars are plotted side-by-side, sharing the X-axis space for that time interval. The default setting is ON.
Overlap
The Graph / Hist. Options / Overlap option specifies that the bars are plotted one on top of the other, with the shorter bars appearing in front of the taller ones. The default setting is OFF.
Sum
The Graph / Hist. Options / Sum option aggregates the data by summing over the selected interval type, e.g., Weekly. This is the default option for fish passage data.
Average
The Graph / Hist. Options / Average option aggregates the data by averaging the values over the selected interval type, e.g., Monthly. This is the default option for river environment data.

Adult Passage GW in Histogram mode, Summed over Monthly Intervals
Data Management...
The Graph / Data Management option opens a dialog for managing and customizing the data axes and their contents. There are four scroll lists to represent the four data axes, each list will contain the Selection Objects that are on that axis. Once a Selection Object is selected from one of the lists, it can be modified by clicking on the Customize... or Data Filter... buttons. There are four axis show/hide checkboxes that control the view of objects in any of the four axes. Hiding an axis removes the SOs contained in that axis from the display view, but it does not delete the SOs from the GW.

Graph / Data Management... dialog
Individual SOs can be moved, copied or deleted from the GW data axes. The Graph / Data Management... / Editing Axes... button opens an alert with instructions for modifying the content of the data axes. See the Data Management section for more details.

Graph / Data Management... / Editing Axes... alert
Data Management
The Graph / Data Management option opens a specialized dialog for adding data and modifying which Selection Objects will be displayed on which axes. This dialog shows a list of the SOs currently contained in each axis.
Graph / Data Management...
Customize...
Highlighting a SO and clicking on the Customize... button opens a dialog that allows the user to customize the SO including the display settings and the year range and location of the data set. The data parameter, e.g., River Environment Dissolved Gas Percent, of the SO cannot be modified.
Data Filter...
Highlighting a SO and clicking on the Data Filter... button opens a dialog that allows the user to specify minimum and maximum data values or maximum rate of change to filter out data from the retrieved data set for the SO.
Editing Axes...
Individual SOs can be moved, copied or deleted from the GW data axes. Clicking on the Graph / Data Management... / Editing Axes... button opens an alert with brief instructions for modifying the data axes content.
Move
To move a SO between axes, left-click-drag and drop a SO with the mouse from the original axis list to the new axis list. The new axis must be a compatible data type if the new axis already contains other SOs. If the new axis does not already contain SOs, then the respective "Show" checkbox for the axis will need to be checked in order to view the data.
Copy
To copy a SO to a new axis, hold the Control key and then left-click-drag and drop the SO to a new axis. The Control must be pressed down before performing the left-click-drag and drop action with the mouse. The new axis must be a compatible data type if the new axis already contains other SOs. If the new axis does not already contain SOs, then the respective "Show" checkbox for the axis will need to be checked in order to view the data. Changes to the display settings of one copied SO will be applied to all copies of the SO.
Delete
To delete a SO from the axis and the GW, highlight the SO to be deleted and then press the Delete key. This action cannot be undone.
Show Checkboxes
The "Show" checkbox for each data axis controls whether that individual axis, and all of its data, will be displayed in the GW. Note: The settings for the axis and the list of SOs it contains are not destroyed if the axis is not shown, and may be shown at a later time.


Default Graph Window and Graph / Data Management... dialog with all axes "Shown"

Updated Graph Window and Graph / Data Management... dialog with Right Axis not "Shown"
Customize Selection Object
The Customize Selection Object dialog is accessed from the Graph / Data Management... dialog by highlighting a Selection Object and clicking the Customize... button. The dialog shows all attributes for the current Selection Object, and it allows the user to customize the display settings for the selected SO. It is also possible to modify the location and year range of the SO. The data type of the SO cannot be modified. All customizations will be applied to the SO and the Graph Window after clicking on the OK button.
Graph / Data Management / Customize... dialog
Full Name
The Full Name text input box allows you to modify the full name of the SO. The Full Name value is not currently in use in javaDART.
Abbreviation
The Abbreviation text input box allows you to modify the abbreviation of the SO. The abbreviation value appears as the data text labels in graphics mode, as the column header in text view mode, and as the SO elements in the Graph / Data Management... dialog lists.
Use Default Names
The Use Default Names button will change the values of Full Name and Abbreviation to reflect all current selections in the dialog, including changes to location and year range.
Projects and Locations
The Projects and Locations scroll list allows you to change the geographic data collection location of the SO. After selecting a new location, click on the Use Default Names to update the values for Full Name and Abbreviation to reflect the change in location.
Color
The Color scroll list allows you to specify the color of the plot line used in the GW.
Decoration
The Decoration scroll list allows you to specify a plot symbol to be used in the GW.
Year Range
The Start Year and End Year text input boxes allow you to modify the year range of the SO. Whole years of data can be added or removed from the SO by modifying these values. After changing the year range by modifying either or both years, click on the Use Default Names to update the values for Full Name and Abbreviation to reflect the change in year range.
Note: You cannot modify the year range of a SO if Graph / Over Plot Years is ON.
Histograms
The Hist. Sum and Hist. Average checkboxes toggle between whether to sum or average data when viewing data in histogram mode. By default, passage data is summed and all other data is averaged for the selected histogram interval. See Graph / Hist. Options for more information.
Highlight
The Highlight checkbox controls whether to draw the plot line with regular or thick width. It can be toggled directly in the GW by pointing the mouse at the data text label in the bottom of the graph window and clicking the left mouse button without moving the mouse. See Graph Windows for more information.
Accumulate
The Accumulate checkbox controls whether to accumulate the daily data for the viewable date range. See Graph / Cumulative for more information.
Data Filter
The Data Filter checkbox controls whether to filter the data with the set data filter parameters. Default is ON. See Graph / Data Management... / Data Filter... for more information.
Cancel
Clicking on the Cancel button reverts all settings to the original values and closes the dialog.
OK
Clicking on the OK button applies all current settings, updates all associated windows (Data Management and GW), and closes the dialog.
Data Filtering
The Data Filtration dialog is accessed from the Graph / Data Management... dialog by highlighting a SO and clicking the Data Filter... button. The data filtration process marks data values that are present in the data set and are selected by a SO to be declared invalid, and are therefore not displayed. The Data Filtration dialog allows the user to change the filtering of an individual SO. There are two levels of data filtration in javaDART.
Graph / Data Management / Data Filter... dialog
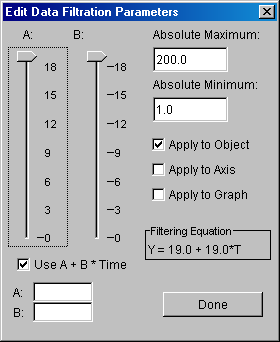
The first data filtration level applies the user specified absolute minimum and maximum values as entered in the Absolute Maximum and Absolute Minimum text input boxes to the SO. By default, this option is applied in combination with maximum rate of change (second level). In order to only apply this level of data filtration, the Use A + B * Time checkbox must be unchecked (default is ON).
The second data filtration level applies the first level of data filtration (absolute minimum and maximum values) and the user specified maximum rate of change, expressed by the Filtering Equation +- A+B*T. The Use A + B * Time checkbox must be checked for this option (default is ON). When specifying maximum rate of change, the user enters "A" and "B" values. The data is processed in time order. The first data value within the absolute limits is accepted as valid. Subsequent data values are accepted if they are within +- A+B*T (where B*T is the number of intervening days) of the last data value that was accepted. There are two sliders that can update the values of "A" and "B" based on the value of the slider. The "A" and "B" values can optionally be entered by typing the desired values in the A and B text input boxes.
To learn more about how to use both data filtration methods, please refer to the Tutorials section.
- Tutorial 1 - Graph Window with Data Filtration using Absolute Values
- Tutorial 2 - Graph Window with Data Filtration using Maximum Rate of Change
The data filtration dialog contains a number of "Apply to" checkboxes. The checked "Apply to" option will determine which Selection Objects will be affected by data filtering. Note: The current Selection Object will always be affected and any Selection Object with data filtering turned off will be unaffected.
Data filtration can be turned on and off directly in the GW by pointing to the data text label at the bottom of a GW in graphic mode and clicking the center or right mouse button without moving the mouse. When data filtration is on, the data labels below the plot will appear in italic font. When data filtration is off, the data labels will appear in plain font. The default mode for javaDART is to have data filtration turned ON. Note: Data filtration does not imply that the data displayed in graphics or text mode does not match the values found in the DART database.
Tutorials
The Tutorials section provides step by step instructions on creating different types of graphs that javaDART is capable of producing. The tutorials cover different aspects of the program to provide a broader view of its capabilities.
| Tutorial 1 - Graph Window with Data Filtration using Absolute Values | |||
|
Topics
|
Program Elements
|
||
| Tutorial 2 - Graph Window with Data Filtration using Maximum Rate of Change | |||
|
Topics
|
Program Elements
|
||
| Tutorial 3 - XY Plot with Graph Image Export | |||
|
Topics
|
Program Elements
|
||
| Tutorial 4 - XY Plot with Parameters at Two Locations against Each Other | |||
|
Topics
|
Program Elements
|
||
Tutorial 1 - Graph Window with Data Filtration using Absolute Values
In this tutorial, you will query the DART database for scrollcase temperature at Bonneville Dam for 1997. You will use X Axis scaling to limit the view of data to the summer months. The data set includes many days where the value is zero. You will apply the absolute minimum and maximum data filter method to filter out the zeros from the data set. You will configure the view mode for text and export the text data from javaDART.
Step 1. Create the initial Graph Window by querying the DART database from the javaDART GUI.
- Start the Graph Window creation process by selecting the type of query, in this case, click on River Environment Graph Type button.
- Select the desired parameters from the now populated scroll lists. To query scrollcase temperature at Bonneville Dam for 1997, select "Water Temp [Scroll Case] (C)" from the Parameters scroll list, "1997" from the Years scroll list, and "BON-Bonneville Forebay [1949]" from the Projects and Locations scroll list.
- Click the Create button to query the DART database and generate the new Graph Window.
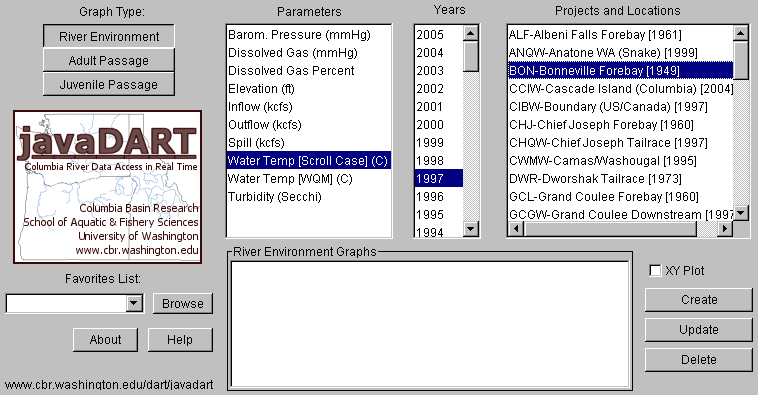
javaDART GUI for River Environment Graph Type with query parameters selected

Initial Graph Window produced by query selections
Step 2. Limit the displayed date range of the graph to the summer months only.
- In the GW, change the minimum date by entering "6/1/1997" in the XMin text input box. The XMin text input box is located in the X Axis Toolbar.
- In the GW, change the maximum date by entering "8/31/1997" in the XMax text input box. The XMax text input box is located in the X Axis Toolbar.
Note: The X Axis Scrollbar reflects the current reduced date range and can be used for panning the date axis while maintaining the current scaling (3 months).

Resulting GW displaying limited date range
Step 3. Remove zeros from the display of data using data filtration.
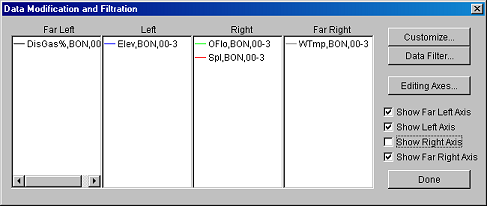
- In the GW, select Graph / Data Management... to open the Data Modification and Filtration dialog.
- In the Data Modification and Filtration dialog, highlight the Selection Object for scrollcase temperature at Bonneville for 1997 by clicking on its abbreviation in the Far Left axis list: "WTmpScr,BON,97."
- Click on the Data Filter... button to open the Edit Data Filtration Parameters dialog.
- In the Edit Data Filtration Parameters dialog, type "1.0" in the Absolute Minimum text input box to remove the zeros from the display of data.
- Press the
Returnkey to activate the change and update the view of data in the Graph Window while the dialog is still open. The graph line changes from solid to dotted where data has been filtered out. Data filtration does not remove the original values from the data set; it only impacts the view of the data. - Click the Done button to close each dialog.
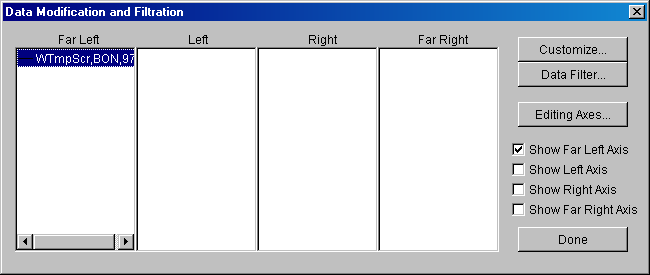
Data Modification and Filtration dialog opened by Graph / Data Management
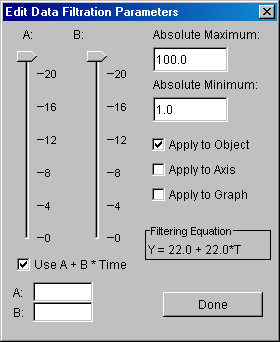
Data Filtration Parameters dialog
Note: By default, the maximum rate of change data filtration method is activated for all Selection Objects. You can turn off this second method of data filtration by unchecking the Use A + B * Time checkbox. In general, the default values set for the maximum rate of change data filtration method are large and do not filter out data. Thus leaving Use A + B * Time checked does not apply an additional level of data filtration to using absolute values for data filtering.

Scrollcase Temperature at Bonneville using Data Filtration to remove zeros
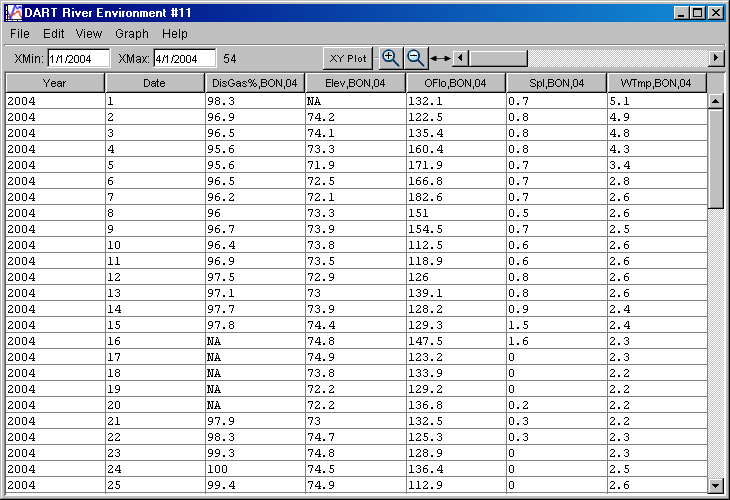
Step 4. Change the view to text and configure the data.
- In the GW, select View / View As Text to select the text view mode.
- In the GW, select View / Text View Options / Missing Data: Space to use spaces for missing and filtered out data values in the data set. The default setting uses the string "NA" to indicate missing and filtered data.
- In the GW, select View / Text View Options / Standard Dates to use the standard MM/DD/YYYY date format in the data set. The default setting is "Julian Dates" or day of year.

View at Text with Standard Dates and Missing Data: Space
Step 5. Select and copy the data for export.
- In the GW, select all data within the date range (6/1/1997 - 8/31/1997) by selecting Edit / Select All or using the keyboard shortcut
Ctrl + A. - In the GW, copy the selected data to the system clipboard by selecting Edit / Copy or using
keyboard shortcut
Ctrl + C. Text columns are tab delimited, so the SO abbreviation and column header value of "WTmpScr,BON,97" will import correctly as a single column value into a spreadsheet application.

View at Text with Select All
Step 6. Import data into Excel or any other spreadsheet program.
- Open Excel or any other spreadsheet program. Use the application-specific paste option to import the copied data from javaDART into the application.
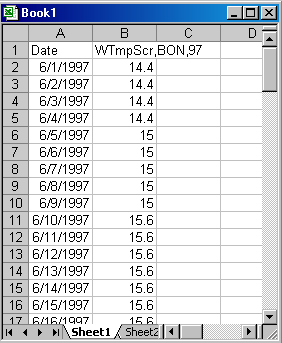
Copied data from javaDART pasted into Excel worksheet
Tutorial 2 - Graph Window with Data Filtration using Maximum Rate of Change
In this tutorial, you will query the DART database for Water Quality Monitor (WQM) temperature at Priest Rapids Dam for 1996-1998. You will use the feature to compare data years to each other. The data set includes anomalous data including unusual spikes and dips in the data most likely caused by the monitoring equipment. The DART database QA/QC procedures do not capture these data spikes and dips within the acceptable range of data values. You will apply the maximum rate of change data filter method to filter out the anomalous data from the data set.
Step 1. Create the initial Graph Window by querying the DART database from the javaDART GUI.
- Start the Graph Window creation process by selecting the type of query, in this case, click on River Environment Graph Type button.
- Select the desired parameters from the now populated scroll lists. To query Water Quality Monitor (WQM) temperature at Priest Rapids Dam for 1996-1998, select "Water Temp [WQM] (C)" from the Parameters scroll list and
"PRD-Priest Rapids Forebay [1961]" from the Projects and Locations scroll list. To select 1996-1998 from the Years list, hold down the
Controlkey while clicking on each year. - Click the Create button to query the DART database and generate the new Graph Window.

javaDART initial Data Selection screen for River Environment Graph Type

Initial Graph Window produced by query selections
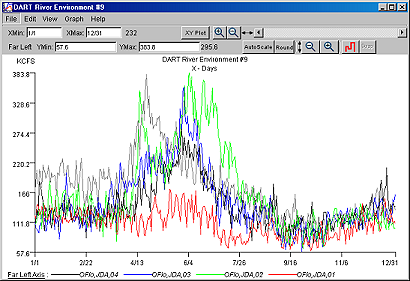
Step 2. Change the data view from consecutive years to individual years.
- In the GW, select Graph / Over Plot Years to change the data view from consecutive years to individual years. The GW now contains three plot lines and three Selection Objects.
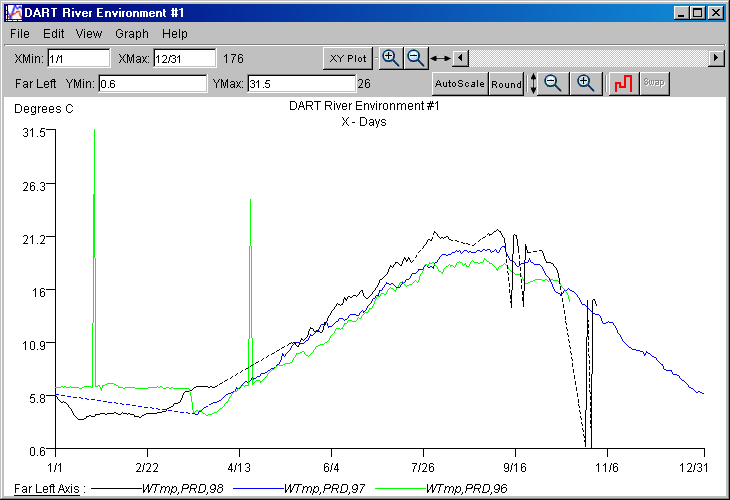
Graph Window with Over Plot Years selected
Step 3. Remove anomalous data for 1996 from the display of data using data filtration.
- In the GW, select Graph / Data Management... to open the Data Modification and Filtration dialog.
- In the Data Modification and Filtration dialog, highlight the Selection Object for WQM temperature at Priest Rapids for 1996 by clicking on its abbreviation in the Far Left axis list: "WTmp,PRD,96."
- Click on the Data Filter... button to open the Edit Data Filtration Parameters dialog.
- In the Edit Data Filtration Parameters dialog, check the Use A + B * Time checkbox (default is checked) to select the maximum rate of change data filtration method.
- In the Edit Data Filtration Parameters dialog, move the A slider to 5 to set the maximum change in value allowed to 5 (degrees) for the interval of time. As the sliders are moved, both the values in the A and B text input boxes and the Filtering Equation will reflect the current slider positions. The data view is actively updated in the GW at the same time.
- In the Edit Data Filtration Parameters dialog, move the B slider to 1 to set the time interval over which the maximum change is applied is 1 day.
- Click the Done button to close each dialog.
- In the GW, the spikes for 1996 data are removed and the plot line is drawn as if the data values were missing (dotted).

GW Graph / Data Management... menu option

Initial Edit Data Filtration Parameters dialog

Edit Data Filtration Parameters dialog

Updated GW with 1996 data filtered
Step 4. Remove anomalous data for 1998 from the display of data using data filtration.
- In the GW, select Graph / Data Management... to open the Data Modification and Filtration dialog.
- In the Data Modification and Filtration dialog, highlight the SO for WQM temperature at Priest Rapids for 1998 by clicking on its abbreviation in the Far Left axis list: "WTmp,PRD,98."
- Click on the Data Filter... button to open the Edit Data Filtration Parameters dialog.
- Set the maximum rate of change parameters in the Edit Data Filtration Parameters dialog the same as for 1996: check the Use A + B * Time checkbox (default is checked), move the A slider to 5, and move the B slider to 1.
- As the sliders are moved, both the values in the A and B text input boxes and the Filtering Equation will reflect the current slider positions. The data view is actively updated in the GW at the same time.
- In the Edit Data Filtration Parameters dialog, type "1.0" in the Absolute Minimum text input box to filter out the 0.6 values at the end of the year in the data set.
- Click the Done button to close each dialog.
- In the GW, the dips in data for 1998 are filtered out and the plot line is drawn as if the data values were missing (dotted).
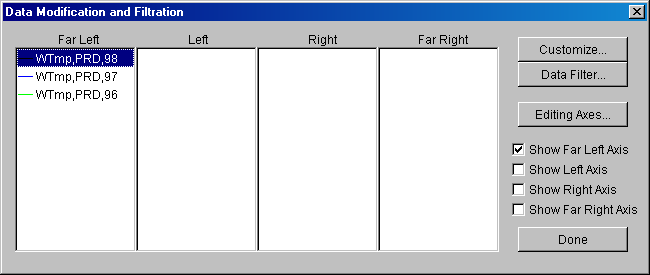
Data Modification and Filtration dialog

Edit Data Filtration Parameters dialog
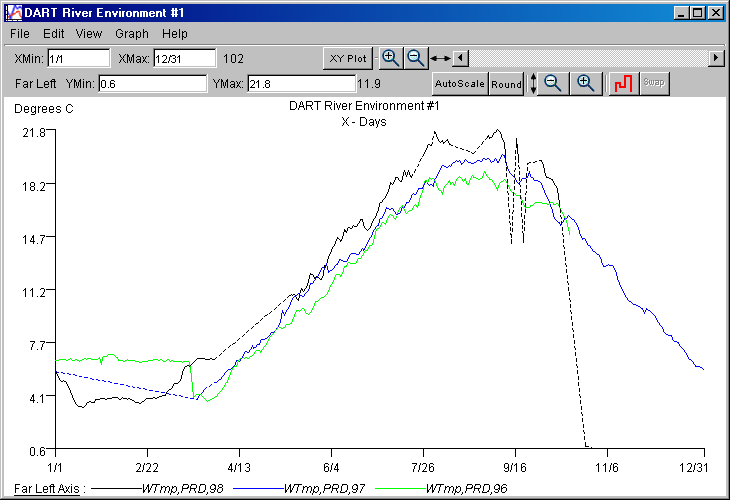
Updated GW with maximum rate of change data filtration applied to 1996 and 1998

Edit Data Filtration Parameters dialog

Final GW with data filtration applied to 1996 and 1998
Tutorial 3 - XY Plot with Graph Image Export
In this tutorial, you will query the DART database for dissolved gas percent and spill at Ice Harbor Dam and Tailrace for 2003-2004. You will use the XY Plot and Linear Regression features of javaDART to analyze spill at the dam on dissolved gas percent in the tailrace. You will scale the data axes using the Y Axis Toolbars. You will export the image from javaDART.
Step 1. Create the initial Graph Window by querying the DART database from the javaDART GUI.
- Start the Graph Window creation process by selecting the type of query, in this case, click on River Environment Graph Type button.
- Select the desired parameters from the now populated scroll lists to query for dissolved gas percent and spill at Ice Harbor Dam and Tailrace for 2003-2004.
- Hold down the
Controlkey while selecting "Dissolved Gas Percent" and "Spill (kcfs)" from the Parameters scroll list. These will be the two data parameters we will compare. - Hold down the
Controlkey while selecting "2003" and "2004" from the Years scroll list. - In the DART database, data collected at the dam (e.g., outflow, spill) are loaded into both forebay and tailrace records for the dam. In order to examine spill (collected at the dam) on tailrace dissolved gas percent, select the tailrace location for Ice Harbor Dam "IDSW-Ice Harbor Tailrace [1995]" from the Projects and Locations scroll list.
- Click in the XY Plot checkbox (located above the Create button) to select the XY Plot mode.
- Click the Create button to query the DART database and generate the new Graph Window.
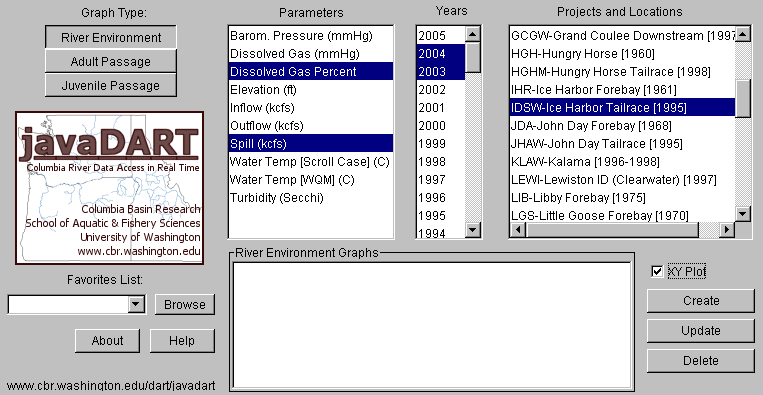
River Environment Graph Type selection with XY Plot checked

River Environment XY Plot
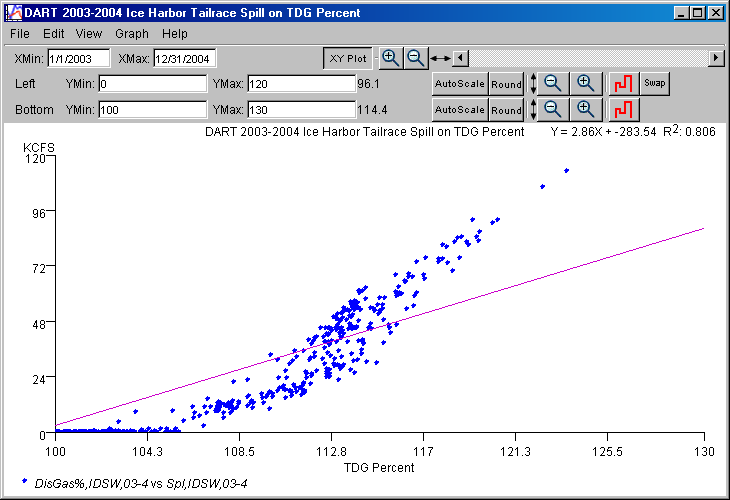
Step 2. Add linear regression and equation to GW, swap the data axes, and scale the data axes.
- In the GW, select Graph / Linear Regression to add a linear regression and equation to the plot.
- In the GW, click the Swap button in the "Left" Axis Toolbar to swap the data axes of Dissolved Gas Percent and Spill. This produces a scatter plot of Spill on Dissolved Gas Percent.
- In the GW, change the data axes scaling for the "Left" axis (Spill) by entering "120" in its YMax text input box. The YMin and YMax text input boxes are located in the Y Axis Toolbar of the "Left" axis.
- In the GW, change the data axis scaling for the "Bottom" axis (Dissolved Gas Percent) by entering "100" in its YMin text input box and "130" in its YMax text input box. The YMin and YMax text input boxes are located in the Y Axis Toolbar of the "Bottom" axis.

XY Plot with linear regression added, data axes swapped, and data axes scaled
Step 3. Edit the text labels in the Graph Window.
- In the GW, select Edit / Labels... to open the Edit Graph Labels dialog.
- In the Edit Graph Labels dialog, change the title of the GW from the default title by typing "DART 2003-2004 Ice Harbor Tailrace Spill on TDG Percent" in the Main Label text input box. This changes the title that appears on the plot as well.
- In the Edit Graph Labels dialog, change the text label for the "Bottom" axis from the default value by typing "TDG Percent" in the Bottom Axis Label text input box.
- Click the OK button when finished with the Edit Graph Labels dialog to update the graph.

Edit Graph Labels dialog
XY Plot with linear regression, swapped data axes, data axes scaling, and customized labels
Step 4. Save the graph image to the local system.
- In the GW, select File / Save Image As... to open the Save Graph Image As file manager.
- In the Save Graph Image As file manager, navigate the local system to the desired folder/directory in which to save the file.
- In the Save Graph Image As file manager, select JPEG image from the "Files of type" drop down menu. javaDART also supports the PNG image file format.
- In the Save Graph Image As file manager, type in the name of the image in the "File name" text input box and click the Save button.
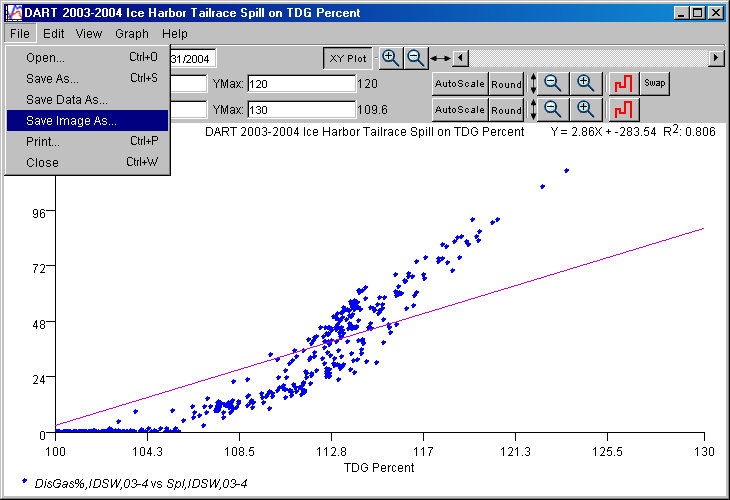
GW displaying File / Save Image As... menu selection
Step 5. Alternatively, copy the graph image to the local system.
- In the GW, select Edit / Copy to copy the graph image to the system clipboard.
- Open the desired local application or document, e.g. MS Word.
- Use the application-specific paste option to import the copied image from javaDART into the current program.
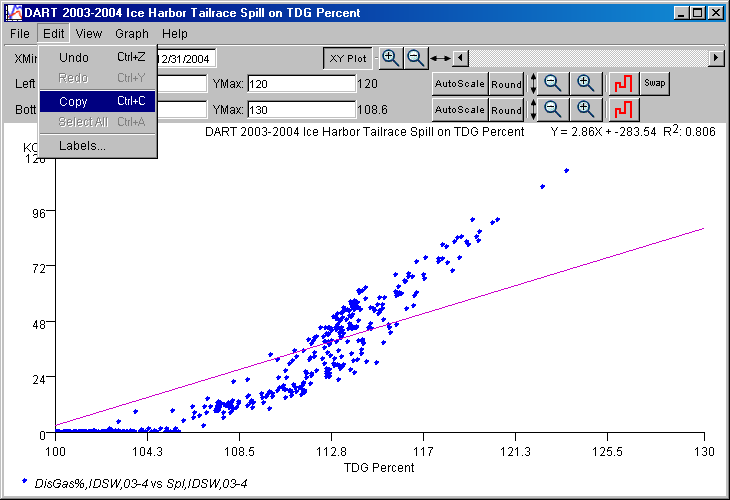
GW displaying Edit / Copy menu selection
Tutorial 4 - XY Plot with Parameters at Two Locations against Each Other
In this tutorial, you will query the DART database for water temperature data for 2001 at the Water Quality Monitors (WQM) located on the Washington side of McNary Dam forebay and the Columbia River at Pasco, Washington. You will use the XY Plot and Linear Regression features of javaDART to analyze water temperature at Pasco on water temperature at McNary. You will swap and scale the data axes using the Y Axis Toolbars.
Step 1. Create the initial Graph Window by querying the DART database from the javaDART GUI.
- Start the Graph Window creation process by selecting the type of query, in this case, click on River Environment Graph Type button.
- Select the desired parameters from the now populated scroll lists to query for water temperature data for 2001 at the Water Quality Monitors (WQM) located on the Washington side of McNary Dam forebay and the Columbia River at Pasco, Washington.
- Select "Water Temp-[WQM] (C)" from the Parameters list and "2001" from the Years list.
- Hold down the
Controlkey while selecting "MCN-McNary Forebay (WA) [1956]" and "PAQW-Pasco WA (Columbia)" from the Projects and Locations scroll list. These will be the two locations we will compare. - Click the Create button to query the DART database and generate the new Graph Window.

River Environment Graph Type selection with two locations selected
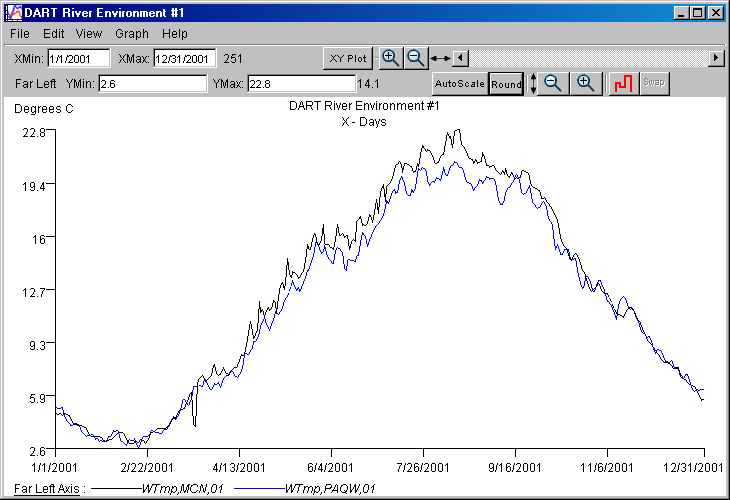
River Environment GW with two locations
Step 2. Activate XY Plot mode.
- Click the XY Plot button in the Graph Window X Axis Toolbar to activate the XY Plot mode. Note: After clicking the XY Plot button the Graph Window will appear empty, i.e., there will be no data displayed in the Graph Window.

Initial XY Plot mode GW with two locations
Step 3. Configure the data axes for comparing two locations in XY Plot mode.
- In order to plot the data values from two locations against each other, we must re-arrange the Selection Objects to be contained within opposing data axes.
- In the GW, select Graph / Data Management... to open the Data Modification and Filtration dialog. Selection Objects can be copied or moved from axis to axis using this dialog. Initially, Selection Objects for both locations are contained in the "Left" axis.
- In Data Modification and Filtration dialog, move the water temperature at McNary Selection Object from the "Left" axis list to the "Bottom" axis list by highlighting "WTmp,MCN,01" and dragging the object to the "Bottom" axis list. Clicking on the Editing Axes... button will open an alert with instructions for moving, copying, and deleting contents of the axes.
- Click the Done button close the dialog. The resulting graph is a scatter plot of days that temperature data is available for the two locations.

Initial Data Modification and Filtration dialog
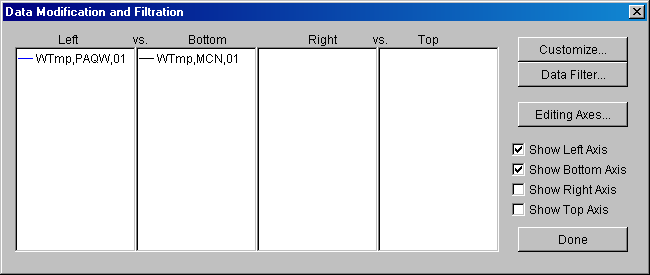
Data Modification and Filtration dialog with SOs on paired data axes
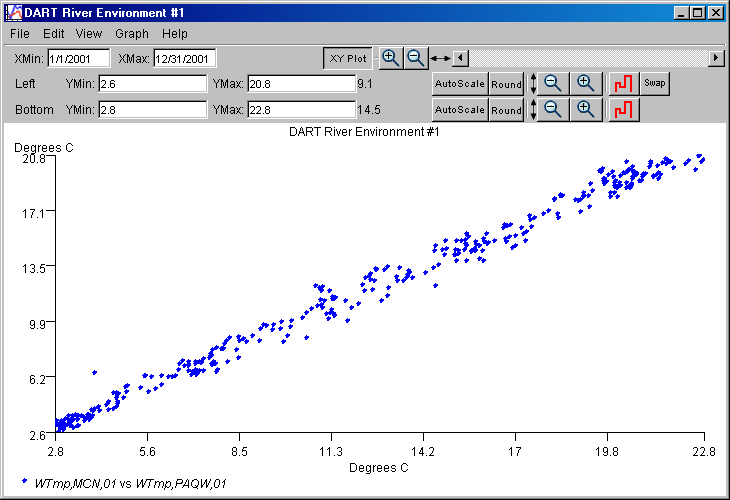
GW in XY Plot mode for two locations
Step 4. Add linear regression and equation to GW and scale the data axes.
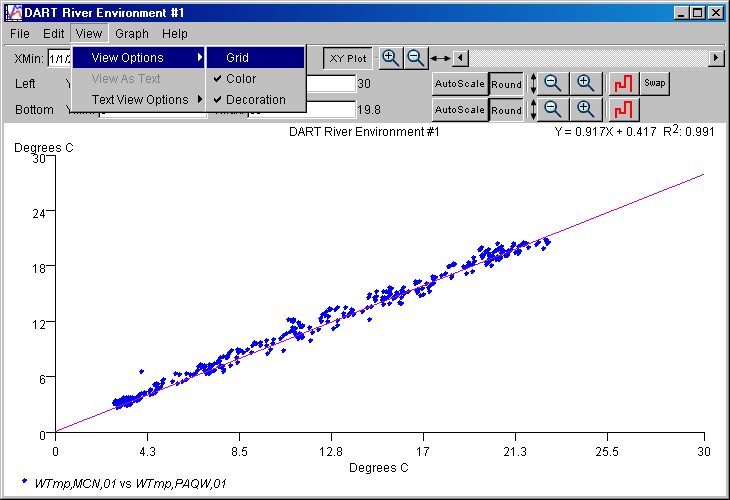
- In the GW, select Graph / Linear Regression to add a linear regression and equation to the plot.
- In the GW, click the Round button in the "Left" Axis Toolbar to round the data axis scaling.
- In the GW, click the Round button in the "Bottom" Axis Toolbar to round the data axis scaling.

GW in XY Plot mode for two locations with Linear Regression and using Round axis scaling
Step 5. Customize the plot.
- In the GW, select View / View Options / Grid to add a grid to the plot.
- In the GW, select Edit / Labels... to open the Edit Graph Labels dialog.
- In the Edit Graph Labels dialog, change the text label for the "Left" axis from the default value by typing "Pasco (C)" in the Left Axis Label text input box.
- In the Edit Graph Labels dialog, change the text label for the "Bottom" axis from the default value by typing "McNary (C)" in the Bottom Axis Label text input box.
- Click the OK button when finished with the Edit Graph Labels dialog to update the graph.
View / View Options / Grid menu option
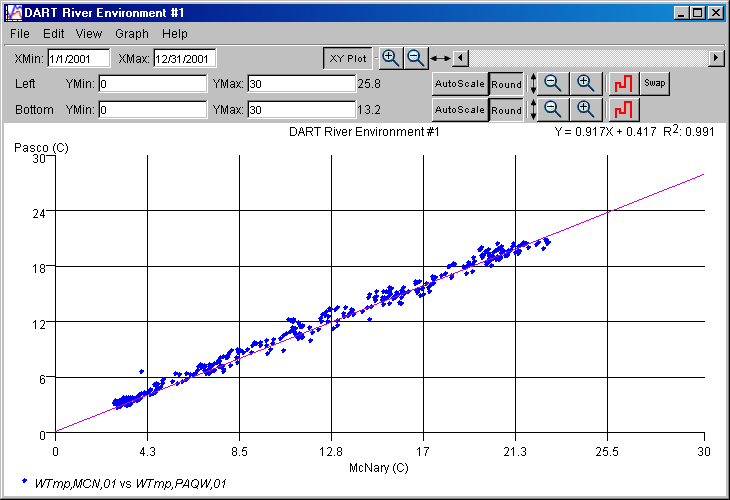
Final GW in XY Plot mode for two locations
Data Glossary
| Term | Definition |
|---|---|
| Chinook Adult | This parameter represents the total number of adult chinook (Oncorhynchus tshawytscha) counted at the dam (project). This includes only fish judged to be fully mature (age 3 to 5). |
| Chinook Jack | This parameter represents the subadult but reproductively mature chinook counted at the dam. Jacks return after one year in the ocean, two to three years before typical adults. The fraction of the population that returns early may be fairly constant, which means that jack counts could give an indication of how strong the adult return will be in two or three years. USACE designates jack chinook salmon as fish between 12 and 22 inches in length. |
| Coho Adult | This parameter represents the total number of adult coho (Oncorhynchus kisutch) observed at the dam; only mature individuals are counted. |
| Coho Jack | This parameter represents the total number of jack coho, usually two-year-old, returning early to the river. USACE designates jack coho salmon as fish between 12 and 18 inches in length. |
| Sockeye Adult | Adult sockeye (Oncorhynchus nerka) typically return to spawn after spending two or more years in the ocean; their counts are represented in this field. |
| Steelhead Adult | This parameter represents the total count of adult steelhead (Oncorhynchus mykiss), both wild and hatchery. A few steelhead adults may spawn and survive to return to the ocean, unlike other salmonid stocks. The Steelhead Adult parameter includes both hatchery and wild counts. Prior to 1995, wild steelheads were not monitored. |
| Steelhead Wild Adult | This parameter is a subset of Steelhead Adult. It represents the count wild adult steelhead and may include unmarked hatchery fish. Prior to 1995, wild steelheads were not monitored. |
| Chinook Adult 10Yr Avg | This parameter represents the 10 year average1 for adult chinook. |
| Chinook Jack 10Yr Avg | This parameter represents the 10 year average1 for jack chinook. |
| Coho Adult 10Yr Avg | This parameter represents the 10 year average1 for adult coho. |
| Sockeye Adult 10Yr Avg | This parameter represents the 10 year average1 for adult sockeye. |
| Steelhead Adult 10Yr Avg | This parameter represents the 10 year average1 for adult steelhead. |
| Bull Trout | This parameter represents the total ladder count of bull trout. |
| Lamprey | This parameter represents the total ladder count of lamprey. |
| Shad | This parameter represents total ladder counts of shad (Alosa sapidissima). Shad were introduced on this coast in 1871 and have since become quite abundant; they support a substantial fishery in their native habitat on the east coast of North America. |
| Chinook-0 Hatchery Smolt | These parameters represent the Smolt Index for subyearling (age 0) chinook (Oncorhynchus tshawytscha) counted at the dam. Over the span of the Smolt Index data set (1985 to the present), there are three possible individual rearing types: Wild (unclipped), Hatchery (clipped), and Unknown. The distinction between wild and hatchery smolts is available only for the years 1985-1999. Since the year 2000, the only individual rearing type category is Unknown. Two classes of fish counts are recorded: collection counts at traps and passage indices at dams. Collection counts are sample counts divided by the sample rate, but not adjusted for flow. Passage indices are collection counts divided by the proportion of water passing through the sampling system. Passage indices are not population estimates, but are used to adjust collection counts for daily fluctuations in the project's operations and to determine run times. The Fish Passage Center (FPC) defines the classes of counts presented for each site (http://www.fpc.org/Metadata/FPC_SMP_Metadata.htm). Most samples occur over a 24-hr period that spans two calendar days. |
| Chinook-0 Wild Smolt | |
| Chinook-0 Unknown Smolt | |
| Chinook-0 Smolt (all) | |
| Chinook-1 Hatchery Smolt | These parameters represent the Smolt Index for yearling (age 1) chinook (Oncorhynchus tshawytscha) counted at the dam. See Chinook-0 Smolt definition for more information about fish counts. Since the year 2000, the only individual rearing type category is Unknown. |
| Chinook-1 Wild Smolt | |
| Chinook-1 Unknown Smolt | |
| Chinook-1 Smolt (all) | |
| Coho Hatchery Smolt | These parameters represent the Smolt Index for coho (Oncorhynchus kisutch) counted at the dam. See Chinook-0 Hatchery Smolt definition for more information about fish counts. Since the year 2000, the only individual rearing type category is Unknown. |
| Coho Wild Smolt | |
| Coho Unknown Smolt | |
| Coho Smolt (all) | |
| Sockeye Hatchery Smolt | These parameters represent the Smolt Index for sockeye (Oncorhynchus nerka) counted at the dam. See Chinook-0 Hatchery Smolt definition for more information about fish counts. Since the year 2000, the only individual rearing type category is Unknown. |
| Sockeye Wild Smolt | |
| Sockeye Unknown Smolt | |
| Sockeye Smolt (all) | |
| Steelhead Hatchery Smolt | These parameters represent the Smolt Index for wild (unclipped) or hatchery (clipped) steelhead (Oncorhynchus mykiss) counted at the dam. See Chinook-0 Hatchery Smolt definition for more information about fish counts. Since the year 2000, the only individual rearing type category is Unknown. |
| Steelhead Wild Smolt | |
| Steelhead Unknown Smolt | |
| Steelhead Smolt (all) | |
| Barom. Pressure | Barometric Pressure is atmospheric pressure at the site, given in mm Hg. It represents an average of hourly measures. Barometric Pressure is measured at Water Quality Monitoring stations in the forebay and tailrace of most projects and other key locations in the basin. Prior to 1995, the data are from a variety of sources within the U.S. Army Corps of Engineers. |
| Dissolved Gas | Dissolved gas is a measure of the pressure of dissolved gas in the water column. When spillway water plunges into the tailrace nitrogen is forced into the water at higher than normal levels. This condition, called supersaturation, occurs when dissolved gas pressure in the water actually exceeds the atmospheric pressure. The dissolved gas value represents an hourly average and is derived from U.S. Army Corps of Engineers gas monitoring efforts. Often collected at irregular intervals, this parameter may be missing values for one or more days, or reported values may be obviously incorrect. We do not provide quality control on this data domain. Dissolved Gas is measured at Water Quality Monitoring stations in the forebay and tailrace of most projects and other key locations in the basin. Prior to 1995, the data are from a variety of sources within the U.S. Army Corps of Engineers. |
| Dissolved Gas Percent | Gas percent reflects the degree of total dissolved gas supersaturation in the river at the given location. Gas percent is the daily mean of hourly observations. When gas pressure is exactly the same as the atmospheric pressure, the water is considered to be 100% saturated. If the gas pressure value is higher than atmospheric pressure, gas percent values rise above 100%. Values less than 100% are considered errant values resulting from the collection measuring devices. Gas percent data is often found to be quite noisy. Dissolved Gas Percent is measured at Water Quality Monitoring stations in the forebay and tailrace of most projects and other key locations in the basin. Prior to 1995, the data are from a variety of sources within the U.S. Army Corps of Engineers. |
| Elevation | Elevation is given in feet above mean sea level and is a daily average of hourly measures. At most sites this will change less than a fraction of a foot over normal operations. Elevation is measured in the forebay of a project. |
| Inflow | Inflow measurements represent the daily average of hourly measures, reported by the USACE. Inflow is given in kcfs and represents the total flow into any project. |
| Outflow | Outflow measurements represent the 24-hour average of hourly measures, reported by the USACE. Outflow is given in kcfs, thousands of cubic feet per second. This represents the total flow at any project, including spill and fish ladder flow. |
| Spill | Spill is the measure of water released through a dam's spillway rather than through its turbines. Spill is reported in kcfs and is given as a daily average of hourly measures taken by the USACE. |
| Water Temp (Scroll Case) | Water Temperature (Scroll Case) is water temperature in degrees Celsius. This data is measured at the scroll case (part of the powerhouse) at a project. If provided values are in Fahrenheit, they are converted to Celsius. Temperature records are typically not collected outside the salmon migration season. |
| Water Temp (WQM) | Water Temperature (WQM) is water temperature in degrees Celsius. This data is measured at Water Quality Monitoring stations in the forebay and tailrace of most projects and other key locations in the basin. Temperature records are typically not collected outside the salmon migration season. The Water Quality Monitoring system started in 1995. |
| Turbidity | Turbidity measures the water clarity, and by inference, the amount of particulate matter present. Turbidity is measured in the forebay or in the fish ladders of a project. Turbidity is reported in feet and measured with a Secchi Disk. In general, the Secchi disk is a 20 cm circular black and white plate. The Secchi disk is attached to a calibrated line and lowered into the water to the depth at which it disappears. The disk is then lifted until it reappears. The arithmetic mean of the two depths is considered the Secchi disk transparency or limit of visibility. (General definition from the Illinois Indiana Sea Grant web page on Water Clarity (http://www.iisgcp.org/wic/secchi.htm)). |
1 Calculating the 10 year averages: The ten year averages are calculated by DART for each day of data at each project. For the current year and any given project/month/day, the data is summed from the previous 10 years and divided by the number of non-null data points available during that 10 year span.
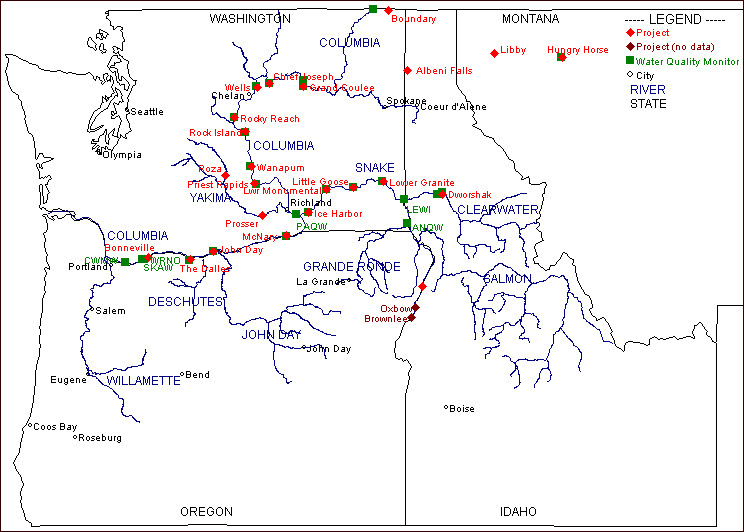
Map
A map of data collection locations in the Columbia Basin included in javaDART. The map does not include all data collection locations, e.g. Juvenile Passage trap locations.