
PIT Tag Adult Ladders Fallback Methods
DART PIT Tag Adult Fish Ladders Fallback ascent and fallback analysis implemented August 2017. "Index of fallback" process implemented September 2018.
Adult PIT Tag Data for Analysis
On a daily basis, DART retrieves and uploads release and detection updates from PTAGIS. DART has developed a Life Stage Filter, ESU/DPS Filter, and Transportation Filter that are applied to all releases and detections. Based on DART categorizations of PIT Tagged fish and user-selections, a list of qualifying Tag IDs at the selected Adult Fish Ladder Project is generated and the full detection history is generated for ascent and attempt analysis. Required: categorized as "adult" detection by DART and not released in the same calendar year as detection. Release year exception: if included by user, fish tagged at BONAFF, Bonneville Adult Fish Facility or LGRLDR, Lower Granite Fish Ladder.
Site Configurations
Adult Fish Ladder site configurations are based on information retrieved daily from PTAGIS and converted into the CBR Site Configuration file used by multiple analysis programs.
The ascent and fallback analysis covers the site configurations for:
- Bonneville (BO1, BO2, BO3, BO4) 2006 to present
- The Dalles* (TD1, TD2) 2013 to present
- John Day* (JO1, JO2) 2018 to present
- McNary (MC1, MC2) 2006 to present
- Ice Harbor* (ICH) 2006 to present
- Lower Monumental* (LMA) 2014 to present
- Little Goose* (GOA) 2014 to present
- Lower Granite (GRA) 2016 to present.
Determination of Ascents and Attempted Ascents
- A sequence of detections of a tag on a ladder are determined to be an ascent if (both):
- the tag is first detected on the entry coils AND
- the "final detection" on the ladder is at an exit coil.
- A detection is considered the "final detection" if (any):
- it is the last detection for that tag,
- the next detection following a detection at an exit coil is at an entry coil (see exceptions for Bonneville below), OR
- the next detection is at a different ladder (see exceptions for Bonneville below).
- If the final detection is not at an exit coil, it is considered an attempted ascent.
- LIMITATIONS:
- Only the detection history for all fishway ladders at a project, e.g., McNary Oregon Shore (MC1) and Washington Shore (MC2) ladders, for a tag is analyzed. Full upstream migration history for a tag is not included in this analysis.
- Only the detection history for a tag within a calendar year is analyzed. If the fish overwinters, the ascent count is reset to zero for the next calendar year.
- If the time between first detection and last detection at the project is greater than 2 weeks, the tag is marked ignore.
| Project | Ladder | Entry Coils | Exit Coils |
|---|---|---|---|
| Bonneville | BO1 | 04, 0F, 10, 11, 12, 13, 14, 1F, 20, 21, 22, 23, 24a | 01, 02 |
| BO2 | 0F, 10 | 01, 02, 03, 04 b | |
| BO3 | 17, 18 | 01, 02, 03, 04 b | |
| BO4 | 01, 02, 03, 04 | 01, 02, 03, 04 | |
| The Dalles | TD1 | 02 c | 01 c |
| TD2 | 02 c | 01 c | |
| John Day | JO1 | 05 06 07 08 c | 01 02 03 04 c |
| JO2 | 05 06 07 08 c | 01 02 03 04 c | |
| McNary | MC1 | 0E, 0D, 0F, 10, 11, 12 | 01, 02 |
| MC2 | 0E, 0F, 10, 11, 12, 13 | 01, 02, 03 | |
| Ice Harbor | "North Shore-Right" | 10 0F 0E 0D c | 0C 0B 0A 09 c |
| "South Shore-Left" | 08 07 06 05 c | 04 03 02 01 c | |
| Lower Monumental | "Left Ladder" | 02 c | 01 c |
| "Right Ladder" | 04 c | 03 c | |
| Little Goose | GOA | 02 c | 01 c |
| Lower Granite | GRA | B1, B2, B3, B4 | A1, A2 |
Special Processing for Bonneville
- Ladder BO1 is stand-alone and is treated like the ladders at other projects.
- Ladders BO2 and BO3 feed into BO4, thus for an ascent at BO2 and BO3, a fish must be ultimately detected in BO4.
- Fish can backtrack from BO4 back down into BO2 and BO3, and then go back up into BO4. Thus if a fish in BO4 backs down into the "top coils" of BO2 or BO3, this is considered part of the same ascent — not a new ascent.
- Top coils for BO2: 01, 02, 03, 04
- Top coils for BO3: 01, 02, 03, 04
- Some fish are only detected in BO4, presumably adults that are tagged and released into BO4. For these fish, all detections at BO4 are considered part of a valid ascent.
Fallback Calculations
In monitoring adult salmon fallback rates in real time, ideally one would like to know when fallback events occurred. Unfortunately, with only PIT-tag detection data available, we know when fish ascended the ladder but not when a fallback event occurred. For example, we might see a fish ascend through the ladder on day 1, only to see it reascend on day 4. We do not know when during that four-day period the fallback actually occurred. The practical problem is on what day the fallback event should be assigned when monitoring for changes in fallback rates over time.
A not totally satisfactory solution is to base fallback metrics on the date of known ladder ascent. This is not a perfect solution but, again, few other solutions exist and so far, none better. The consequence of this choice of data summary is that any relationship between daily fallback rates and environmental or operational covariates will be somewhat muddled.
Definitions
- Ascent: A fish seen at the entrance coils of the ladder, and subsequently and finally seen at the exit coils of the ladder.
- Attempted ascent: A fish seen at the entrance coils of the ladder but not seen finally at the exit coils; thus, a fish seen at the entrance, then seen at the exit, and finally seen further downstream in the ladder is counted as an attempted ascent.
- Ignored: In general, this is a fish with limited or inconclusive detection history. A fish seen only at the exit coils of the ladder or with only 1 detection.
- N = number of unique fish to ascend the ladder or project.
- For one ladder on one day, N is the number of unique fish to ascend the ladder on that day. The ascent day is defined by the day the fish exited the ladder.
- Project-wide on a day, N is the number of unique fish to ascend the project on any ladder for that day.
- Season-wide for a ladder, N is the number of unique fish to ascend the ladder over the entire season.
- Season-wide for a project, N is the number of unique fish to ascend the project on any ladder over the entire season.
- F = number of N that fall back, i.e., are seen attempting or ascending the same project on the same day or on a later day.
- MSeason = total number of ascents made by the N fish.
- MDaily = total number of ascents and subsequent ascents made by the NDaily fish.
- P = fallback rate = F/N.
- R = Average number of ascents per fish = M/N.
Implications
- One given fish can be counted more than once. For example if a fish ascends a ladder on days 1, 3, and 4,
- For day 1, it will contribute 1 count to N, 1 to F and 3 to M.
- For day 3, it will contribute 1 count to N, 1 to F and 2 to M.
- For day 4, it will contribute 1 count to N, 0 to F, and 1 to M.
- One given fish can be counted differently across ladders of a project. If a fish ascends ladder 1 on day 1, ladder 2 on day 4 and ladder 1 on day 6,
- For ladder 1, day 1, it will contribute 1 count to N, 1 to F, and 3 to M.
- For ladder 2, day 4, it will contribute 1 count to N, 1 to F, and 2 to M.
- For ladder 1, day 6, it will contribute 1 count to N, 0 to F, and 1 to M.
- Due to points 1 and 2 above, the project statistics for a given day cannot be inferred from the sum of statistics for the individual ladders on that day.
- Similarly, the season-wide statistics cannot be inferred from the sum of the daily statistics.
- During the season, statistics for previous days are updated retroactively. For example, if a fish that initially ascended on day 1 is seen ascending again on day 4, the day 4 calculations will update the statistics for day 1.
- Season-wide, project-wide estimates are the only parameters estimated absolutely. All other measures should be regarded as only indices of fallback behavior.
Calculating an "index of fallback" at adult fishway ladders with limited detectors
In the Columbia and Snake rivers, multiple federal projects have limited adult fishway PIT Tag detectors that provide minimal information on direction of fish movement through the ladders: The Dalles, John Day, Ice Harbor, Lower Monumental, and Little Goose dams. While we cannot differentiate fallback behavior from slideback behavior at these sites, we can at McNary Dam. To demonstrate the validity of using a 2 hour delay criterion at the limited sites to generate an "index of fallback", we analyzed detections in the McNary Dam (MC1) Oregon shore adult fishway, comparing full fallback analysis to perceived fallback using only the window detectors.
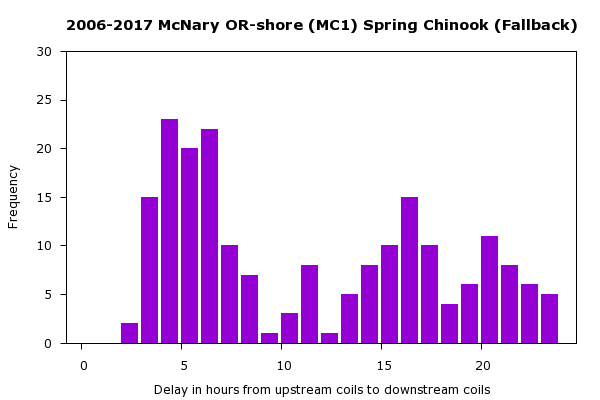
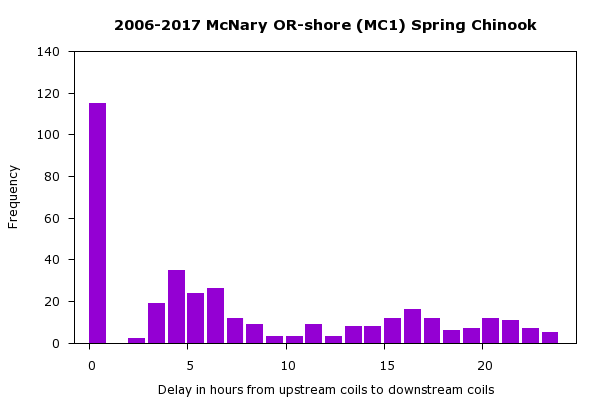
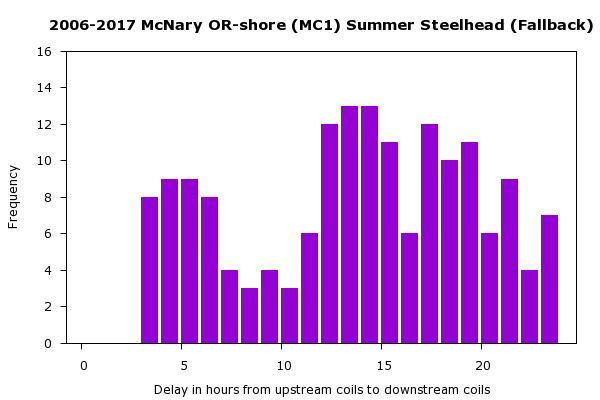
McNary Dam has both window PIT-tag detectors as well as ladder entrance and exit PIT-tag detector arrays. Figure 1a plots fallback frequencies as a function of time delay using the entrance and exit PIT-tag arrays for spring Chinook salmon. Figure 1b plots perceived fallback frequencies as a function of time delay using only the window PIT-tag detectors for spring Chinook adult salmon. Comparison of these two plots shows a spike in perceived fallback at 0-2 hours when discerning fallback using only the window detectors versus actual fallback using the entrance/exit arrays. Figure 2 shows a similar pattern between perceived fallback using only window detectors versus actual fallback using entrance/exit detectors for steelhead (delays of greater than 24 hours are excluded from all plots for clarity). These results suggest a majority of false-positive fallbacks using only window detectors can be eliminated if counts during 0-2 hours are eliminated.
Comparison of perceived fallbacks of spring Chinook salmon at McNary Dam, 2006-2017, based on (a) actual fallbacks based on entrance/exit PIT-tag detections versus (b) window only PIT-tag detections. Note the spike at 0-1 hour in panel (b) that does not occur in panel (a).
Comparison of perceived fallbacks of steelhead at McNary Dam, 2006-2017, based on (a) actual fallbacks based on entrance/exit PIT-tag detections versus (b) window only PIT-tag detections. Note the spike at 0-1 hour in panel (b) that does not occur in panel (a).

PTAGIS Interrogation Site Metadata: https://www.ptagis.org/Sites/InterrogationSites?handler=ShowSite&code=MC1
The Dalles Ladders
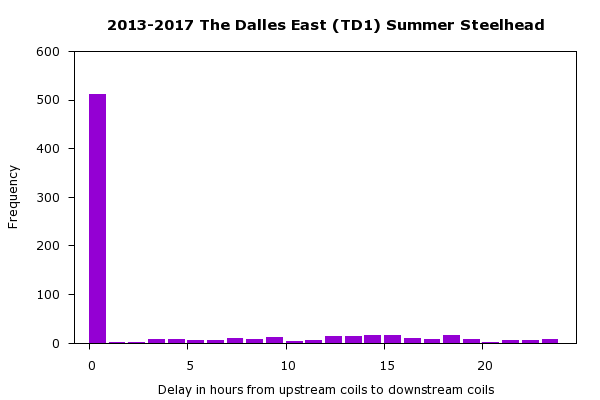
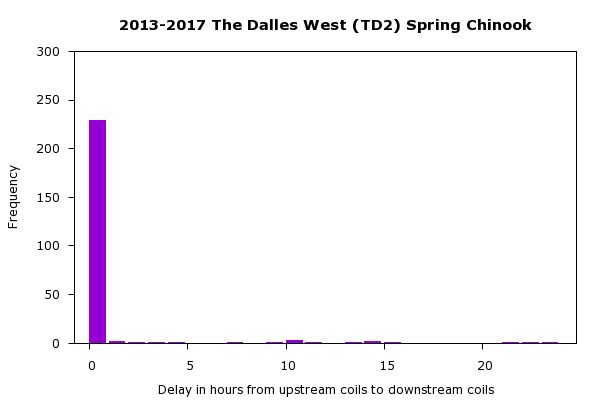
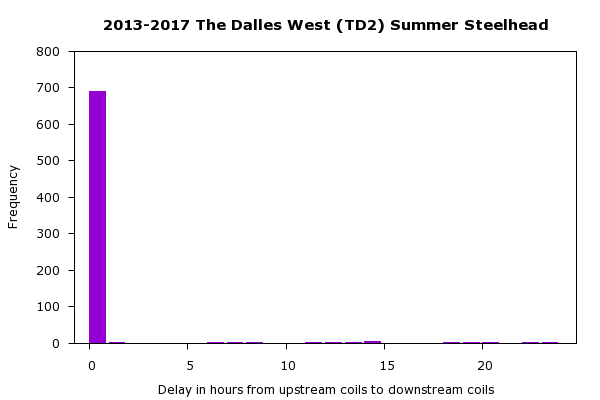
The Dalles Dam has only two PIT-tag detectors in each of the adult ladders. The PIT-tag detectors are located on the upstream and downstream sides of the counting windows. These detectors are in close proximity, and with only two locations, provide minimal information on direction of fish movement through the ladder. Therefore, the limited PIT-tag array configuration at The Dalles could result in false positive indications of fallback that are simply slidebacks through the detectors.
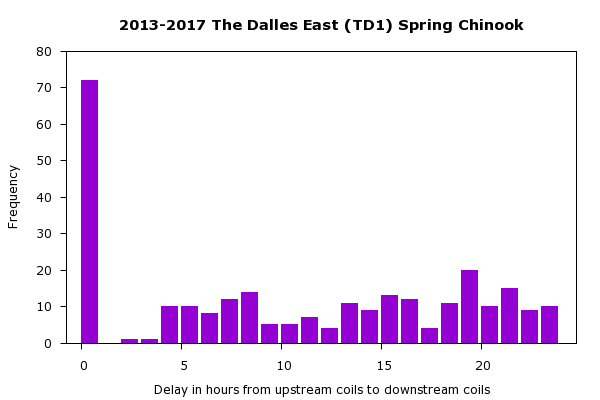
At The Dalles Dam, perceived fallbacks exhibit the same spike in counts at 0-2 hours that was observed at McNary Dam using only the window detectors. We have therefore decided to compute an "index to fallback" at The Dalles Dam by simply excluding any perceived fallback that occurred in ≤2 hours. We acknowledge there may still be false-positive detections of fallback that could be, in actuality, only slidebacks through the window arrays. However, as an index to fallback behavior, this may be tolerable where the purpose is simply to compare historical trends to current patterns.
The Dalles Dam delay in fish ladders using 2013-2017 PIT-tag detections for spring Chinook salmon (a, c) and steelhead (b, d), demonstrating the validity of using the 2 hour delay criterion.
PTAGIS Interrogation Site Metadata: https://www.ptagis.org/sites/interrogation-site-metadata?IntSiteCode=TD1
PTAGIS Interrogation Site Metadata: https://www.ptagis.org/sites/interrogation-site-metadata?IntSiteCode=TD2
John Day Ladders
John Day Dam only has detectors in close proximity and provide minimal information on direction of fish movement through the ladder. Therefore, the limited PIT-tag array configuration at John Day could result in false positive indications of fallback that are simply slidebacks through the detectors.
We have therefore decided to compute an "index to fallback" at John Day Dam by simply excluding any perceived fallback that occurred in ≤2 hours. We acknowledge there may still be false-positive detections of fallback that could be, in actuality, only slidebacks through the arrays. However, as an index to fallback behavior, this may be tolerable where the purpose is simply to compare historical trends to current patterns.
PTAGIS Interrogation Site Metadata: https://www.ptagis.org/Sites/InterrogationSites?handler=ShowSite&code=JO1
PTAGIS Interrogation Site Metadata: https://www.ptagis.org/Sites/InterrogationSites?handler=ShowSite&code=JO2
Ice Harbor Ladders
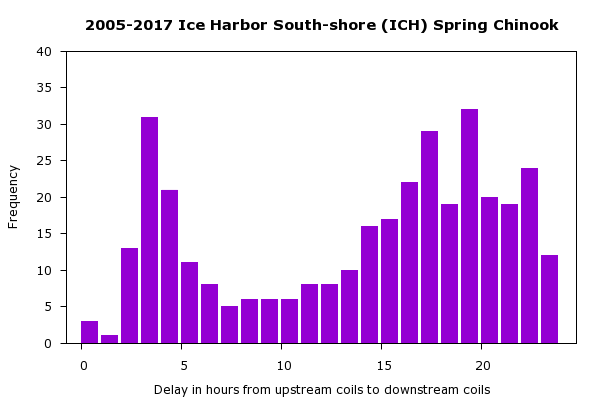
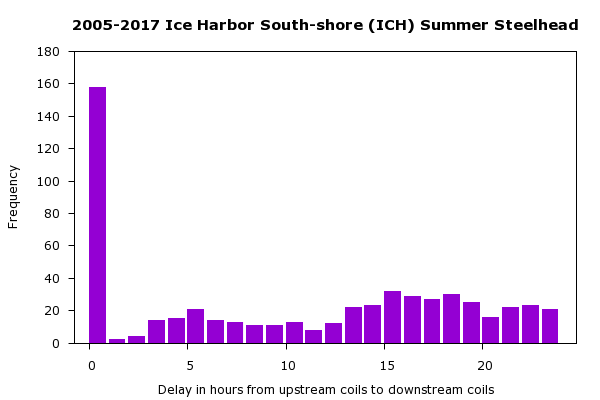
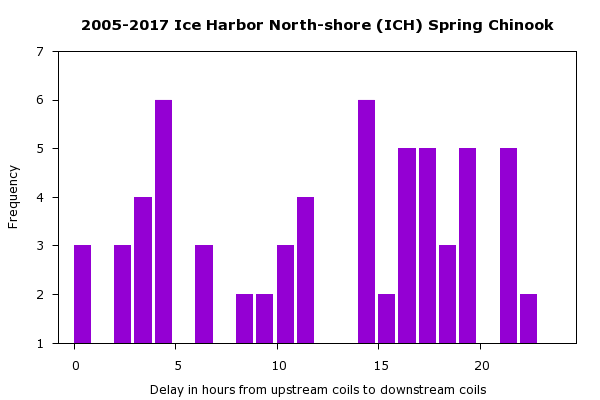
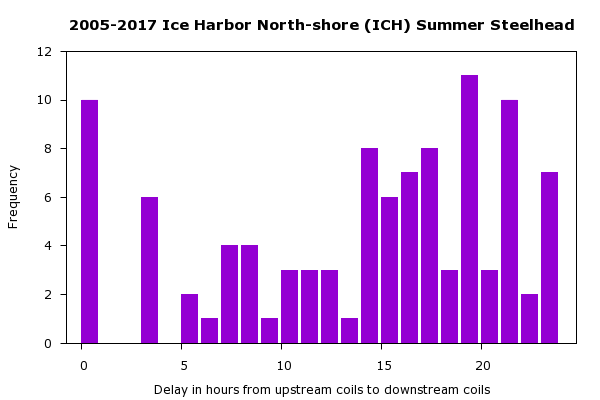
Each of the adult ladders at Ice Harbor Dam has four pairs of PIT-tag detectors. The PIT-tag detectors are located on the upstream side of the counting windows near the fish exit. These detectors are in close proximity to each other, and thus provide minimal information on direction of fish movement through the ladder. Therefore, the limited PIT-tag array configuration at Ice Harbor could result in false positive indications of fallback that are simply slidebacks through the detectors.
At Ice Harbor Dam, if the two upstream pair of detectors are treated as the "exit" detector, and the two downstream pairs are treated as the "entrance" detector, the delay between the exit detector and the entrance detectors exhibit the same spike in counts at 0-2 hours that was observed at McNary Dam. We have therefore decided to compute an "index to fallback" at Ice Harbor Dam by simply excluding any perceived fallback that occurred in ≤2 hours. We acknowledge there may still be false-positive detections of fallback that could be, in actuality, only slidebacks through the arrays. However, as an index to fallback behavior, this may be tolerable where the purpose is simply to compare historical trends to current patterns.
Ice Harbor Dam delay in fish ladders using 2005-2017 PIT-tag detections for spring Chinook salmon (a, c) and steelhead (b, d), demonstrating the validity of using the 2 hour delay criterion.
At Ice Harbor Dam, adults are detected descending downstream via the juvenile bypass system at south shore ladder. These detections provide additional information regarding fallbacks and are treated as follows.
- If the fish is detected only in the bypass, or if it is detected initially in the bypass, the fish is ignored; it may be a kelt traveling downstream.
- If descent through the bypass is the last detection of a fish, it is treated as one additional fallback for that fish.
- If the bypass detections fall in the middle of other ascents for a fish, it provides no additional information.
PTAGIS Interrogation Site Metadata: https://www.ptagis.org/Sites/InterrogationSites?handler=ShowSite&code=ICH
Lower Monumental Ladders
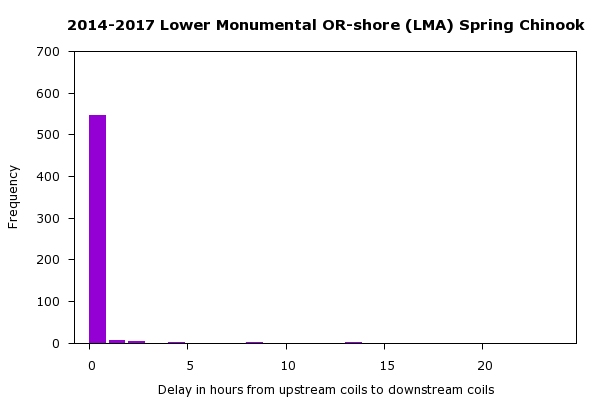
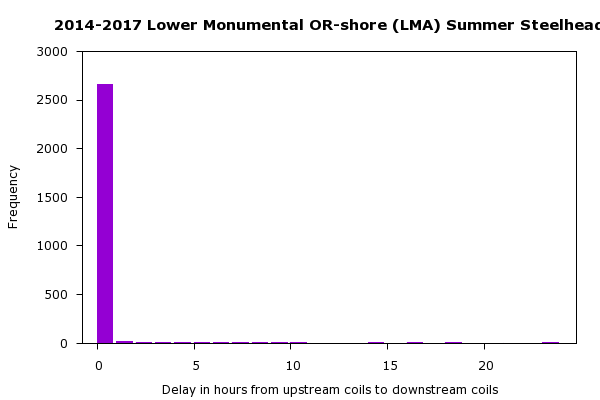
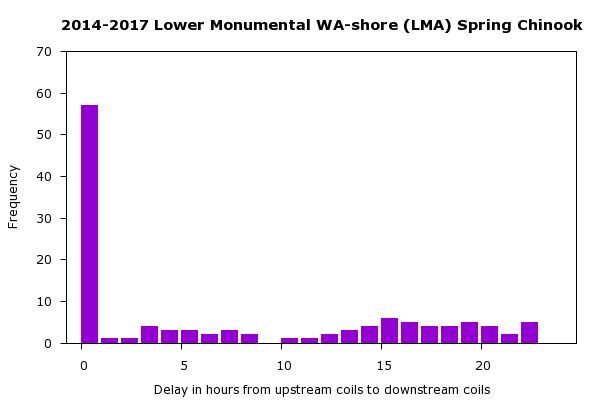
Lower Monumental Dam has only two PIT-tag detectors in each of the adult ladders. At this time, there are no PTAGIS configuration diagrams for the ladders. Given the similarity of configuration to The Dalles Dam, we assume the PIT-tag detectors are located on the upstream and downstream sides of the counting windows. These detectors are in close proximity, and with only two locations, provide minimal information on direction of fish movement through the ladder. Therefore, the limited PIT-tag array configuration at Lower Monumental could result in false positive indications of fallback that are simply slidebacks through the detectors.
At Lower Monumental Dam, perceived fallbacks exhibit the same spike in counts at 0-2 hours that was observed at McNary Dam using only the window detectors. We have therefore decided to compute an "index to fallback" at Lower Monumental Dam by simply excluding any perceived fallback that occurred in ≤2 hours. We acknowledge there may still be false-positive detections of fallback that could be, in actuality, only slidebacks through the window arrays. However, as an index to fallback behavior, this may be tolerable where the purpose is simply to compare historical trends to current patterns.
Lower Monumental Dam delay in fish ladders using 2014-2017 PIT-tag detections for spring Chinook salmon (a, c) and steelhead (b, d), demonstrating the validity of using the 2 hour delay criterion.

PTAGIS Interrogation Site Metadata: https://www.ptagis.org/Sites/InterrogationSites?handler=ShowSite&code=LMA
Little Goose Ladder
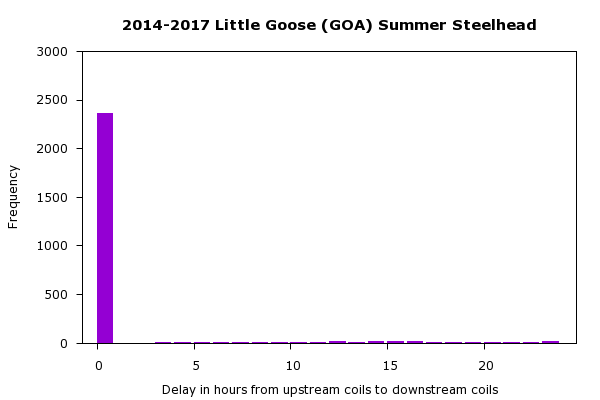
Little Goose Dam has only two PIT-tag detectors at the adult ladder. The PIT-tag detectors are located on the upstream and downstream sides of the counting window. These detectors are in close proximity, and with only two locations, provide minimal information on direction of fish movement through the ladder. Therefore, the limited PIT-tag array configuration at Little Goose could result in false positive indications of fallback that are simply slidebacks through the detectors.
At Little Goose Dam, perceived fallbacks exhibit the same spike in counts at 0-2 hours that was observed at McNary Dam using only the window detectors. We have therefore decided to compute an "index to fallback" at Little Goose Dam by simply excluding any perceived fallback that occurred in ≤2 hours. We acknowledge there may still be false-positive detections of fallback that could be, in actuality, only slidebacks through the window arrays. However, as an index to fallback behavior, this may be tolerable where the purpose is simply to compare historical trends to current patterns.
Little Goose Dam delay in fish ladders using 2014-2017 PIT-tag detections for spring Chinook salmon (a) and steelhead (b), demonstrating the validity of using the 2 hour delay criterion.

PTAGIS Interrogation Site Metadata: https://www.ptagis.org/Sites/InterrogationSites?handler=ShowSite&code=GOA