PTAGIS System Outages 4/17 - 4/20: "Due to a PSMFC-wide infrastructure migration, the PTAGIS systems (website, reporting, data submission) will be inaccessible for periods of time between 4/17 and 4/20." DART will load PTAGIS data as it is made available. Thank you for your patience.
Columbia River DART (Data Access in Real Time)
Explore by Query Style
Quick Look Current Conditions
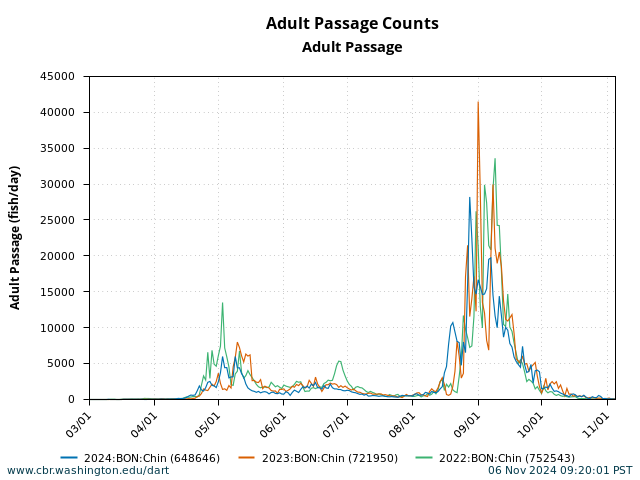
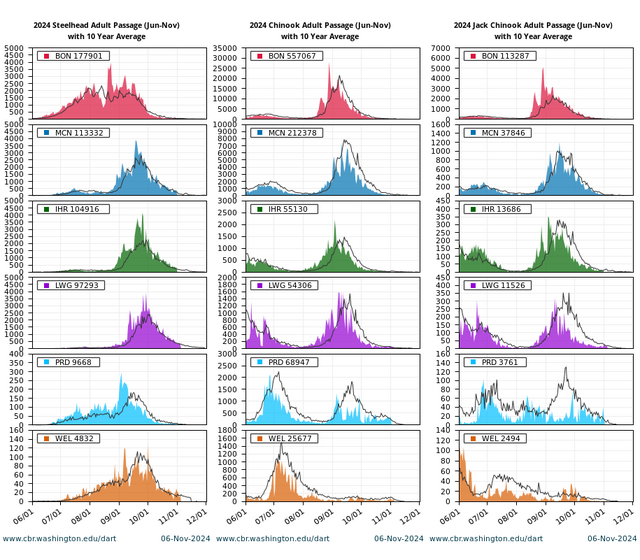
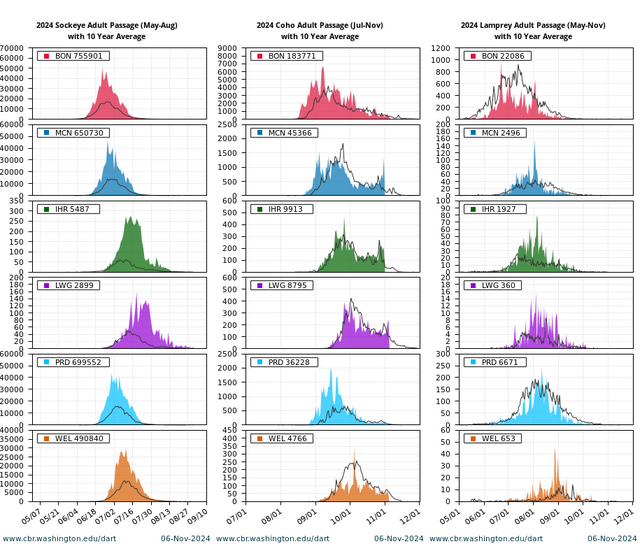
Presents current Columbia Basin Chinook, Steelhead, Sockeye and Coho adult passage counts with the ten year averages at Bonneville, McNary, Ice Harbor, Lower Granite, Priest Rapids, and Wells dams. Updated daily. Carousel figures 1 and 2.
Presents current Bonneville Adult Spring Chinook passage with River Environment and Historical Run Timing. Updated daily. Carousel figures 3 and 4.
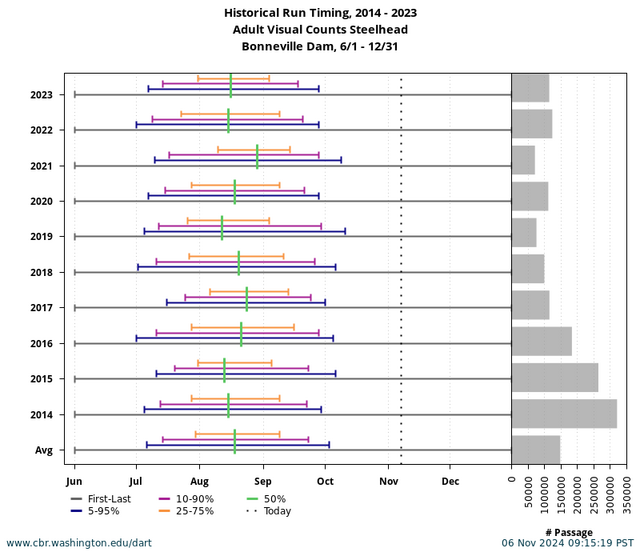
Presents current Bonneville Adult Steelhead passage with River Environment and Historical Run Timing. Updated daily. Carousel figures 5 and 6.
Presents current Columbia Basin ESU and DPS juvenile passage with the ten year averages at Lower Granite, Little Goose, Lower Monumental, McNary, John Day, and Bonneville dams for select ESU/DPS populations. Updated daily.
Presents current and historical fallback rates during the Spring Spill Period at Snake River (4/3-6/20) and Mainstem Columbia River (4/10-6/15) projects. Updated daily during Spring Spill. Carousel figure 7.
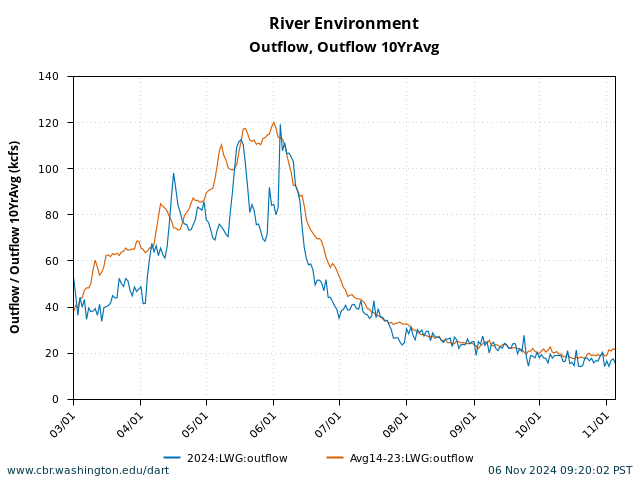
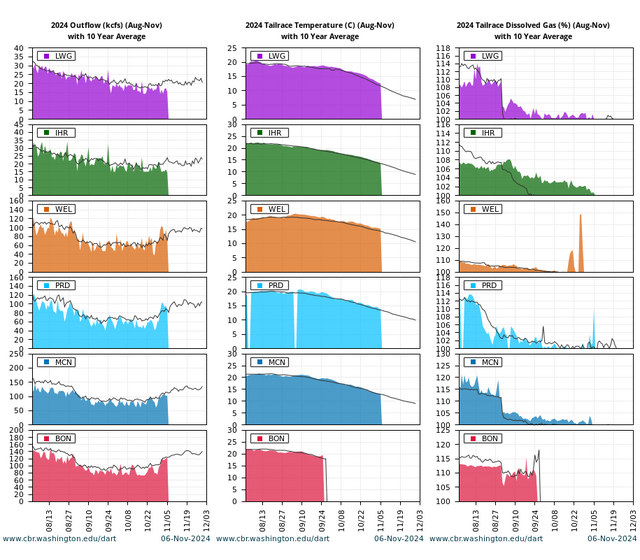
Presents current Columbia Basin river environment with the ten year averages at Lower Granite, Ice Harbor, Wells, Priest Rapids, McNary, and Bonneville dams. Updated daily. Carousel figure 8.
Presents current Columbia Basin Smolt Index with the ten year averages at Lower Granite, Little Goose, Lower Monumental, Rock Island, McNary, John Day and Bonneville dams. Updated daily.
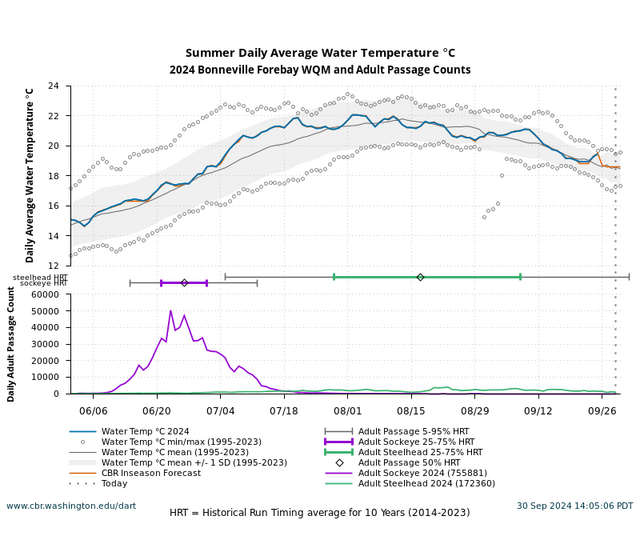
Presents daily average water temperature data June-September at Columbia River and Snake River forebay water quality monitor (WQM) sites with inseason forecast temperatures, highest observed (historical period) and historical mean with +/- 1 standard deviation (SD) for each location. Observed data is updated daily; inseason forecasts are updated weekly. Carousel figure 9.



Specialized Tools and Analyses
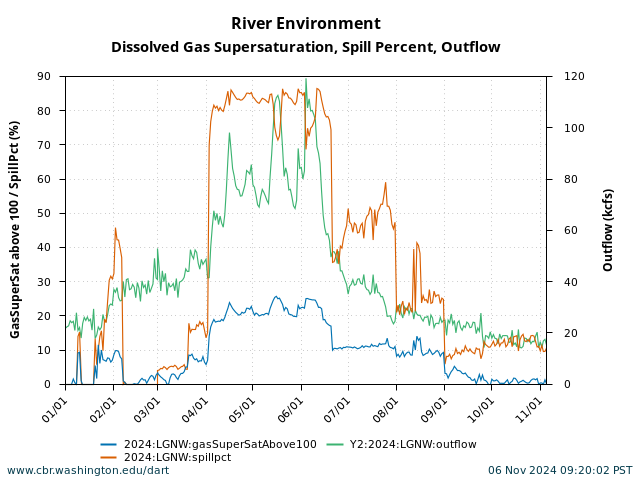
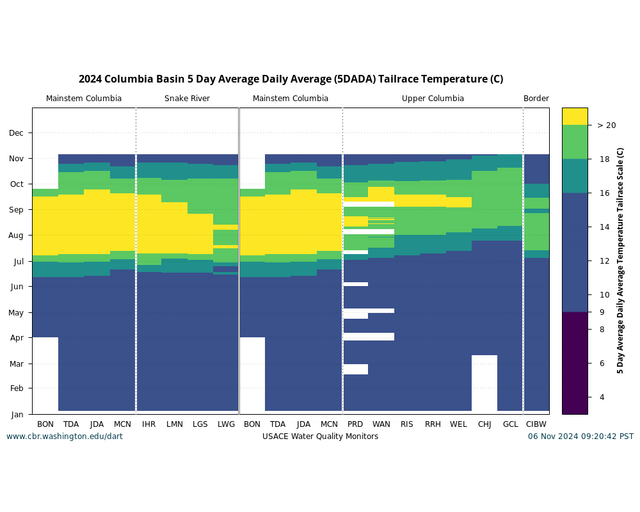
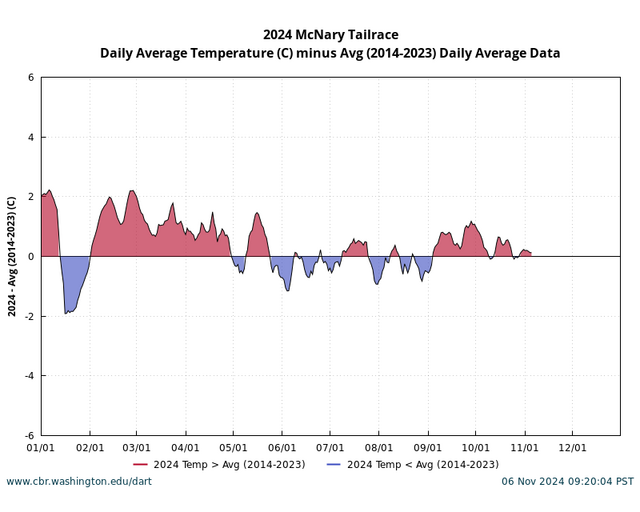
Presents basin-wide current Columbia Basin river environment with comparison to mean years and other years and all years seasonal trends. Scale options for provided for temperature and dissolved gas caps and user-specified thresholds. Updated daily. Carousel figures 1-6.
User-specified threshold analysis of juvenile and adult Fish Exposure to observed River Conditions at Columbia and Snake River dams. Carousel figure 7.
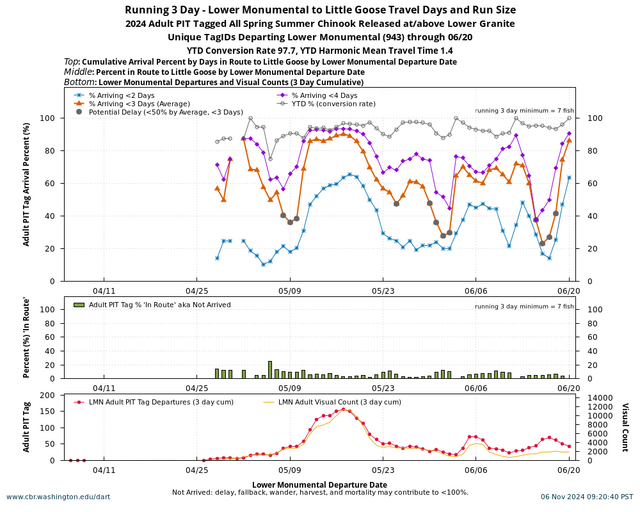
Presents adult PIT Tag reach distribution and delay analysis for Mainstem Columbia and Lower Snake reaches for Spring/Summer Chinook (spring-spill/April-June) and Fall Chinook (August-November). Updated daily. Carousel figure 8.
Presents adult PIT Tag specialized ascent event analysis and timing at Priest Rapids, Rock Island, and Rocky Reach ladders. Updated daily.
Presents PIT Tag movement and timing in Lower Granite Bypass and Spillway for juvenile and adult detections. Updated daily.
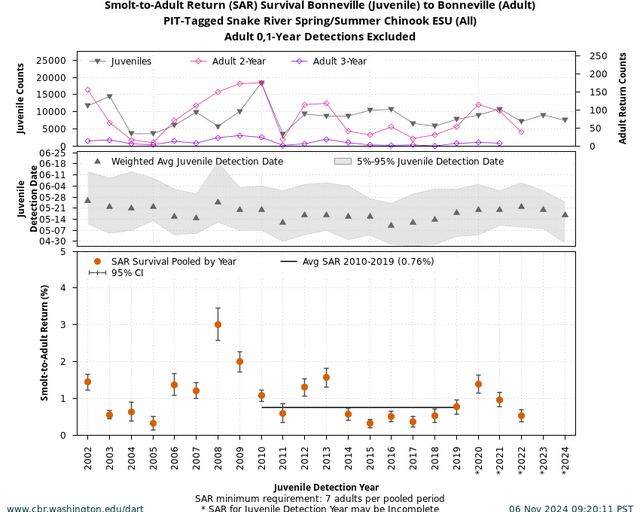
Smolt-to-Adult Return (SAR) Survival analysis for Snake River and Upper Columbia River ESU/DPS populations for multiple juvenile to adult reaches for 2000 to present. Analysis includes information on transportation. Carousel figure 9.
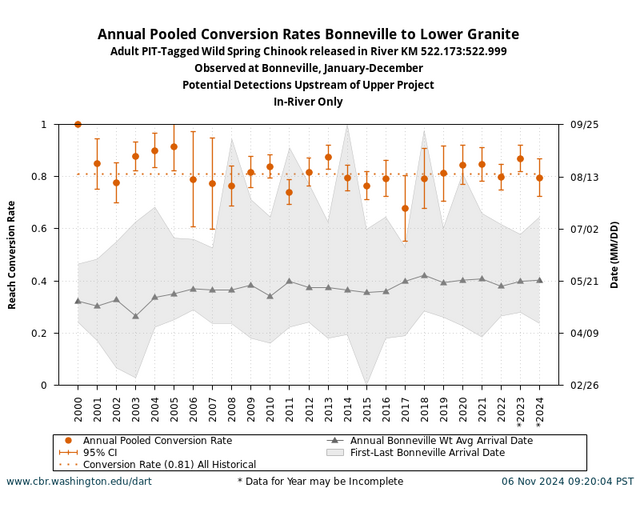
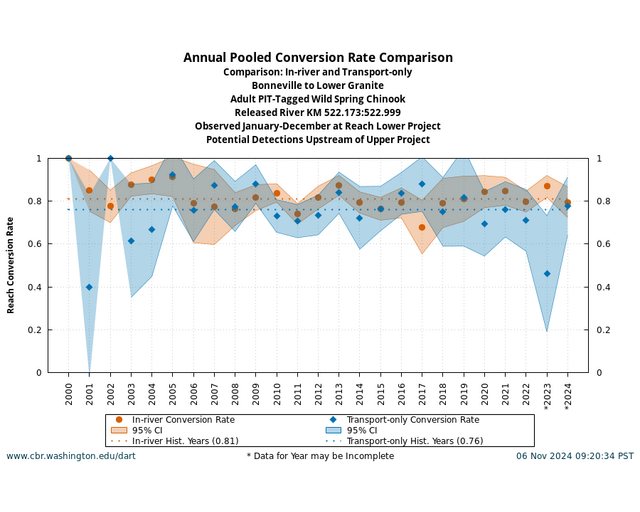
The DART PIT Tag Adult Returns Conversion Rate Report (based on selections made for Release Basin, Conversion Reach, Species, Run, Rear Type, and Month Range) generates a summary of conversion rates by PIT Tag release site for each detection year possible. The Conversion Rate Report includes all adult detections of the selected population at the lower project of the selected conversion reach. Only fish detected at the lower project can be reported as detected at the upper project. Observation numbers are based on the number of unique PIT-tagged fish observed at the project, not on the total number of detections at a project. Carousel figures 10 and 11.
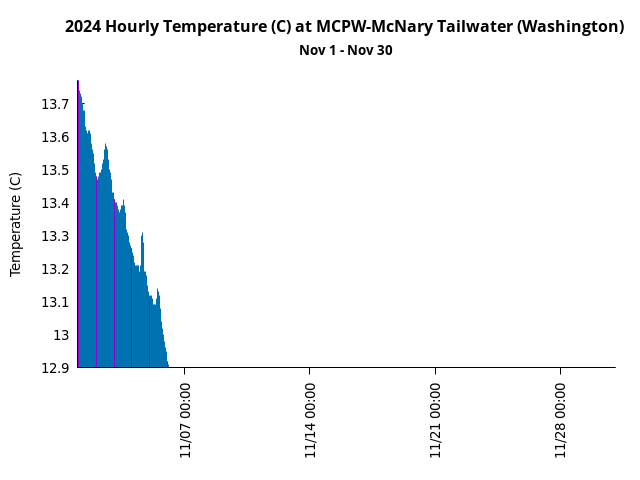
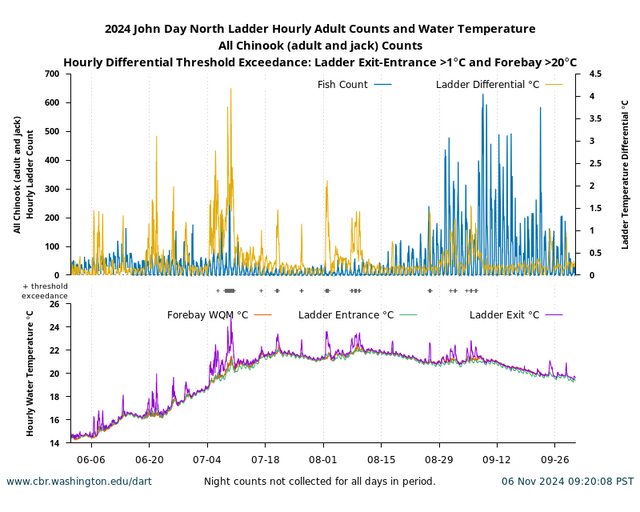
The DART Hourly Adult Fishway Ladder Temperatures and Passage Counts query generates plots and hourly detail tables for specific adult fishway ladders in the mainstem Columbia River and lower Snake River. The results include analysis of Differential Threshold exceedance based on user-specified settings for Ladder Differential and River Temperature. Carousel figure 12.
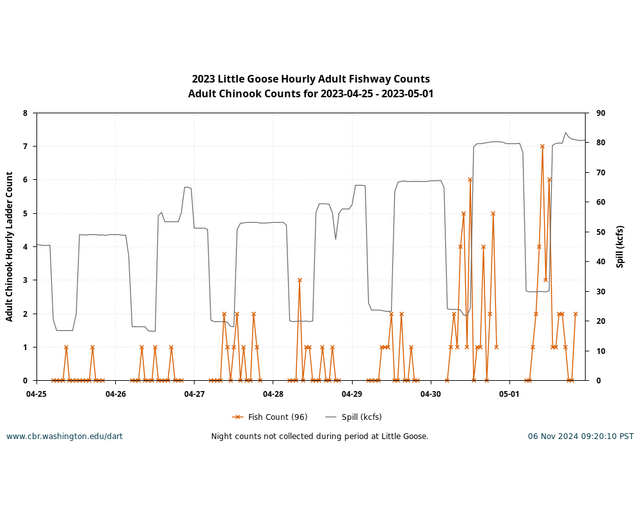
The DART Hourly Adult Fishway Counts with River Environment query generates plots and hourly detail tables for specific adult fishway ladders in the mainstem Columbia River and lower Snake River. Carousel figure 13.



Access all DART Tools
Adult Salmonid Passage
Adult Passage Counts
- Graphics & Text
- Daily Counts
- Quick Look
- Basin Summary
- Project Summary
- Annual Summary
- Monthly Summary
- Ladder Summary
- Historical Run Timing
PIT Tag Adult Returns
- Graphics & Text
- Detail by Observation Year
- Detail by Release Year
- Basin Summary
- Conversion Rate
- Fallback
- Mean Travel Time
- Historical Run Timing
PIT Tag Adult Specialized Analyses
- Reach Distribution & Delay
- Upper Columbia Ladders
- Sampling at Lower Granite Adult Trap
- Detection Probability at Adult Fishways
Sport Fishing
Juvenile Salmonid Passage
PIT Tag Observation by Observation Site
PIT Tag Observation by Release Hydro Unit
PIT Tag Observation by Release Site
PIT Tag Observation by Tag Coordinator
PIT Tag Release & Observation Summary by
- Tag File Selection for Generating Survival & Mean Travel Time Estimates
- General Parameters & Observation Parameters
PIT Tag Specialized Analyses
Smolt Index
Transportation
Trap Collected Counts
PIT Tag Resident Species
Salmonid Releases
Resources
User Feedback
Please use the provided online submission form or email the DART Team directly with any questions, requests, or quality control issues you may have about the data. We are interested in your feedback and experiences with DART. Thank you. dart@cbr.washington.edu


