DART PIT Tag Adult Reach Distribution and Delay Overview and Methods
The DART PIT Tag Adult Reach Distribution and Delay analysis presents daily departure-date cohort calculations to help elucidate the more numerous visual count adult population movement patterns. Actual pre-season and in-season management decision processes are complex employing multiple sources of observed data, models, and forecasts.
Background
The DART PIT Tag Adult Reach Distribution and Delay analysis tool was first implemented in 2018 to provide information on adult Chinook salmon tagged with passive integrated transponder (PIT) tags showing various summary metrics (e.g., percent of 3-day cumulative cohort arriving to next upstream dam in less than N calendar days) and in comparison to adult visual counts. For additional information, river conditions, e.g., spil percent and tailrace total dissolved gas, and smolt indices are presented.
The purpose of the tool is to report in real-time on reach travel time (TT) and highlight potential delay conditions (see Criteria section) in upstream migration for adult PIT-tagged Chinook salmon during the spring spill period at Mainstem Columbia and Lower Snake River reaches. Daily cohorts are created and tracked based on departure date from the dam at the downstream end of the reach of interest, and used to report reach travel time, percent arrival, percent "in route" (i.e., not arrived yet, and could be due to a number of reasons, such as delay, fallback, wandering, harvest, and mortality from predation), as well as comparisons to visual counts.
The percent of fish that arrive at an upstream dam is calculated from PIT-tagged Chinook salmon detections that departed the lower dam of a single reach (or multiple reaches) of interest. Currently, the tool calculates cumulative arrival percents based on running 3-day cumulative cohort departures and single-day departures.
In May 2024, the "Single Departure Event per TagID" query option was added to the tool; it is the current preferred method. Even though the "Daily Cohort" query option was originally developed to be most comparable to the visual counts because it would include any reascensions, a single departure event for each PIT-tagged salmon provides more pertinent information for management of adult salmon travel time and delay.
Methods
On a daily basis, the DART database loads current PTAGIS, Smolt Index, River Conditions, and Adult Visual Counts datasets from primary sources.
Three populations based on release attributes are tracked separately for analysis.
- Spring/Summer Chinook, juveniles released at/above Lower Granite, includes Unknown-run tagged at Lower Granite in April and May. Tracked for spring spill period at Snake River dams, April 3 - June 20 and adult visual counts spring/summer run dates, April - August.
- Spring/Summer Chinook, juveniles released at/above McNary. Tracked for spring spill period at mainstem Columbia River dams, April 10 - June 15.
- Fall Chinook, juveniles released at/above Lower Granite, includes Unknown-run tagged at Lower Granite after June and Unknown-run tagged with coordinator code "WPC". Tracked for adult visual count fall run dates, August - November.
For each unique TagID detected at the lower project as life stage adult, individual coil detections are examined to establish movement maps through the ladders and determine departure dates (may be more than one). TagIDs are grouped by departure calendar date into a single-day cohort and each date-based single-day cohort is tracked separately for reach travel time, conversion rate, and arrival at the upstream project. Fallback, delay, wander, harvest, and/or mortality may result in <100% daily cohort conversion rate; fallback, wander, harvest and mortality are not included in these analyses. The PIT Tag population as a whole is tracked by unique TagID for Year-to-Date (YTD) calculations of harmonic mean reach travel time and conversion rate.
Single Departure Event per TagID: Preferred method. On a date-specific basis, a unique population departing the lower project is established. Ascent events are not restricted to calendar date. This date-specific unique population is tracked to determine cumulative arrival percent at the upper project, harmonic mean TT, and conversion rate. A history of more than 1 ascent event for a TagID is tracked. This may impact arrival success and travel time. Each TagID has only one departure event (the last) date per season. On reascent and departure, the TagID is removed from previous departure date cohort and daily calculations are adjusted.
- 2024-06-04: new departure date cohort for 3DD.003D914B1C. Removed from 2024-06-03 cohort.
- 2024-06-04: new departure date cohort for 3DD.003D95FD88. Removed from 2024-06-03 cohort.
- 2024-05-28: new departure date cohort for 3DD.003DFED370. Removed from 2024-05-27 cohort.
- 2024-05-24: new departure date cohort for 3DD.003D9B8000. Removed from 2024-05-21 cohort.
- 2024-05-21: new departure date cohort for 3DD.003D761D53. Removed from 2024-05-20 cohort.
- …
Daily Cohort: This is the non-preferred method. It is maintained for historical reference. Original logic designed to mimic visual adult passage count dataset. Each ascent and departure tracked per departure date. No adjustments were made to daily cohort departure events for reascent events. That is, TagID departure events may not be unique within a day or a season.
Additional notes:
- Observed departures, arrivals, and predictions are based on daily updates loaded from PTAGIS into the DART database; processing each day's PTAGIS data load for this application may change observed departure dates, arrivals, and predictions.
- Adult Visual Counts presented are the daily sum of adult and jack counts, minijacks are excluded.
- Analysis for the year may be incomplete if viewing current calendar year results. YTD and Daily statistics are updated daily and may change as the year progresses.
- Running 3-Day calculations require a 7-fish minimum departing for each 3-day cohort. This is applied to address small sample size.
- Upper Project 50% Entry Hour requires a 5-fish minimum arriving on each date.
Calculations
NOTE: Observed departures, arrivals, and predictions are based on daily updates loaded from PTAGIS into the DART database; processing each day's PTAGIS data load for this application may change observed departure dates, arrivals, and predictions. In this section, we use observed data example for Spring/Summer Chinook, juveniles released at/above Lower Granite, Ice Harbor to Lower Monumental reach with observed data through 2024-06-04. An excel file is available for download at https://www.cbr.washington.edu/dart/cs/data/reachdist.xlsx that contains the calculations and components.
Single-day Cohort
For each single-day departure cohort, cumulative arrival to the upper project is tracked separately for 0 to 6 calendar days (for single reaches) after the departure day ('day-N'). Over 6 calendar days since departure, the cumulative arrival is enumerated in each individual departure date 'Conversion Rate'.
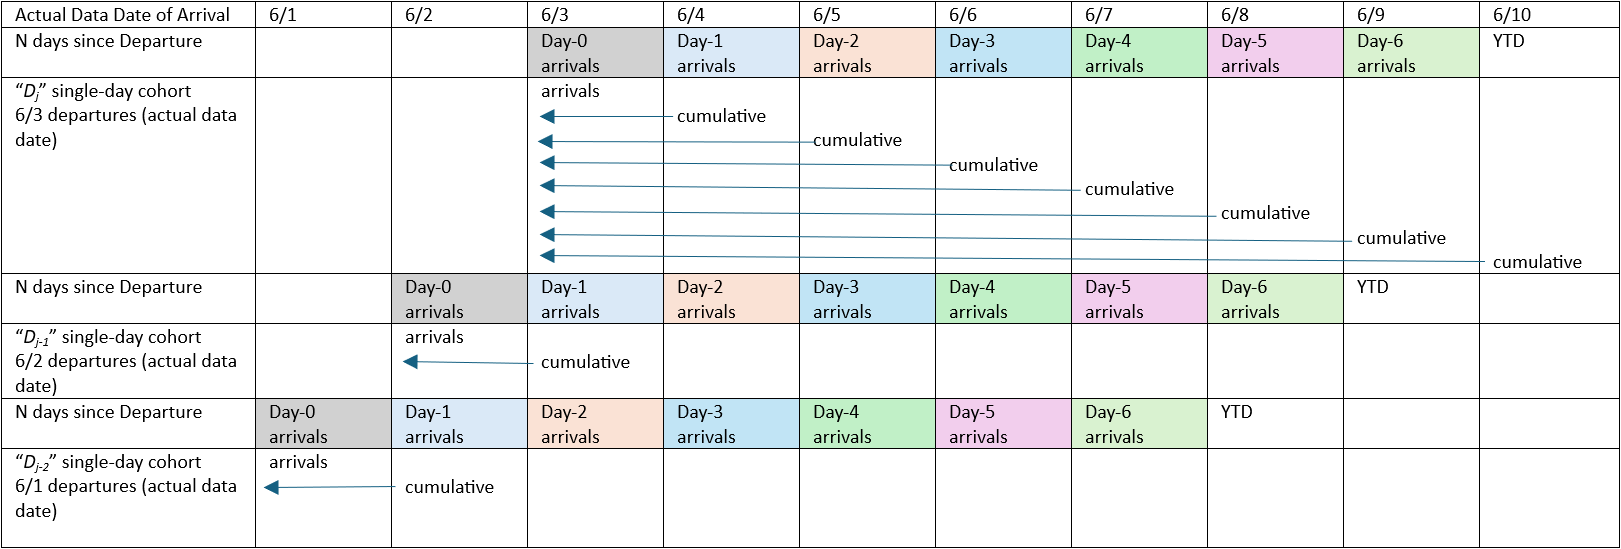
Running 3-day Cohort
The 'Running 3-day' calculations are the sum of the three component single-day departure cohorts. The 'Running 3-day' cohort on “date” Dj is comprised of single-day departure cohorts (departures and arrivals) for the “date” Dj and the 2 prior dates Dj-1 and Dj-2.
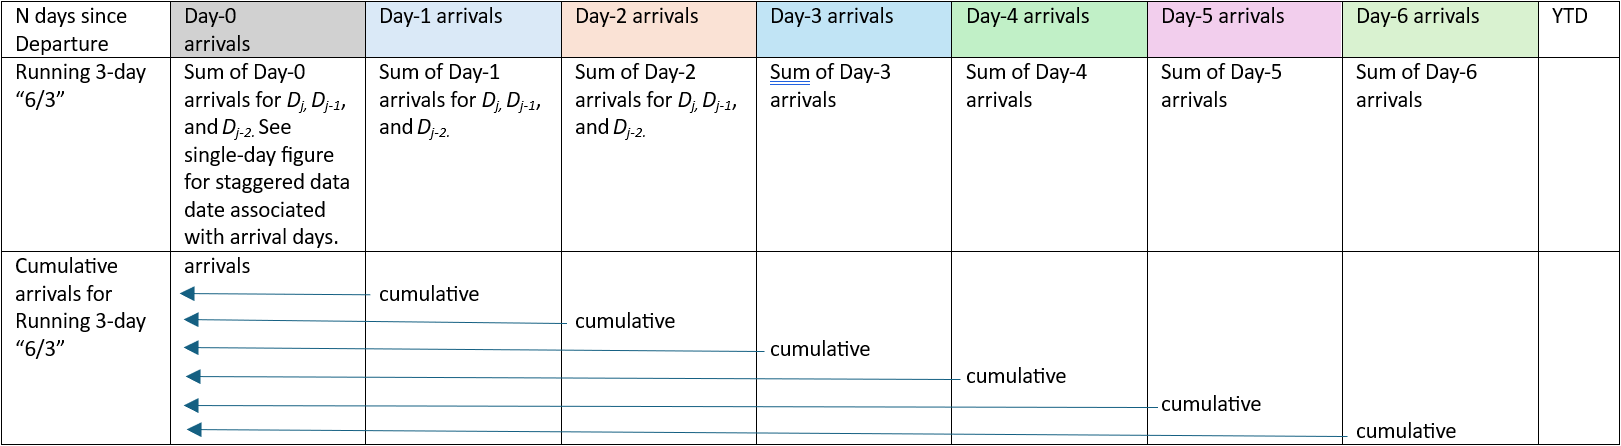
The 'Running 3-day' cumulative arrival for day-N is the sum of the cumulative arrivals for day-N for each of the three component days divided by the sum of departures for each of the three component days. Given the maximum data date, if arrivals for N days after departure are possible for each of the three component days, then day-N is considered 'complete' for the running 3-day cohort and arrival calculations are included in the results.
If N days since departure for at least one component single-day departure cohort represents a date greater than the maximum data date, then cumulative arrivals for day-N is considered incomplete, 'incomplete day-N' and are not included in the results table.
2-day Predicted Range
The 2-day Predicted Range provides a range of possible cumulative arrival percent for incomplete running cumulative 3-day cohorts using calculations from single-day cohort departures and arrivals and Running 3-day cumulative cohort departures. The “2-day Prediction Range” calculations are applied to the 'Running 3 Day' cohorts and appear in the results table in square brackets and shaded green. The predicted lower limit is based on known arrivals through the maximum data date and the predicted upper limit is based the sum of cumulative arrivals and possible new arrivals (i.e., not arrived).
For one and two days greater than the maximum complete day-N for the 'Running 3-day' cohort, arrivals are known for 2 or 1 of the component dates. If N is less than 6, prediction range calculations are made. Prediction range calculations are based on known departures and arrivals for the three component single-day cohorts through the maximum data date.
In the 'Running 3-day' example for 2024-06-03, the maximum data date is 2024-06-04. Cumulative arrivals for day-0 and day-1, arrivals for 0 and 1 day since departure, respectively, are complete for the running 3-day cohort. Arrivals are known for at least one component single-day cohort for day-2 and day-3 (Table 11).
| Running 3-day for "6/3" | day-0 'complete' | day-1 'complete' | incomplete day-2 = Prediction Day 1 | incomplete day-3 = Prediction Day 2 |
|---|---|---|---|---|
| Arrivals known for day-N with Max Date 6/4 | single-day cohorts for 6/1, 6/2, 6/3 | single-day cohorts for 6/1, 6/2, 6/3 | single-day cohorts for 6/1, 6/2 | single-day cohorts for 6/1 |
The predicted range lower limit for 'incomplete day-N' is:
- Prediction Day 1 (one day greater than last complete day-N) = Available cumulative arrival for running 3-day through day-(N-1) plus the known arrivals for N days since departure for single-day departures cohorts, i.e., Dj-1 and Dj-2.
- Prediction Day 2 (two days greater than last complete day-N) = Available cumulative arrival for running 3-day through day-(N-1) plus the known arrivals for N days since departure for single-day departures cohorts, i.e., Dj-2.
The predicted range upper limit for 'incomplete day-N' is:
where the “Total possible arrivals for 'incomplete day-N'” is the sum of known arrivals for day-N and “Possible new arrivals” for each single-day departure cohort for day-N, i.e., not arrived as of N days since departure. Each single-day departure cohort can only be counted in 'arrivals' or 'possible new' not both for incomplete day-N. “Possible new arrivals” is:
Departures for single-day departure cohort – cumulative arrival count for single-day departure cohort for day-N
- Prediction Day 1 (one day greater than last complete day-N): Arrivals are known for Dj-1 and Dj-2 and are accounted for in the sum of known arrivals for day-N. For Dj, day-N represents a date greater than the maximum data date. “Possible new arrivals” are calculated for Dj: departures for Dj minus the cumulative arrival count through day-N for Dj. “Possible new arrivals” is equivalent to fish not arrived for Dj.
- Prediction Day 2 (two days greater than last complete day-N): Arrivals are known for Dj-2 and are accounted for in the sum of known arrivals for day-N. For Dj and Dj-1, day-N represents a date greater than the maximum data date. “Possible new arrivals” are calculated for both Dj and Dj-1 and then summed.
| Running 3-Days End Date (departure events >= 7) ▻ shaded red: Arrival on Avg (2) Day < 50% | Adult PIT Tag | ||||||||||
|---|---|---|---|---|---|---|---|---|---|---|---|
| Departure Events Ice Harbor for period | Lower Monumental Entry Events for Fish departing ICH during period viable for Cumulative Arrival % calculations | Cumulative Arrival Percent Lower Monumental Calendar Days after Ice Harbor Departure ▻ shaded gray: 50% arrival day ▻ shaded gold: ConRate < 85% (at least 7 fish; fallback, delay, wander, harvest, mortality can all attribute to <100%) ▻ shaded green: Prediction Range based on departures and detections for individual days included in 3-day cohort |
Total Lower Monumental Entry Events for Fish departing ICH during period | ||||||||
| 0 | 1 | 2 | 3 | 4 | 5 | 6 | Conversion Rate | ||||
| 2024-06-04 | 31 | 0 | 0.0 | [16.1 - 58.1] | [32.3 - 96.8] | 10 | |||||
| 2024-06-03 | 24 | 5 | 0.0 | 20.8 | [54.2 - 83.3] | [58.3 - 91.7] | 14 | ||||
| 2024-06-02 | 28 | 11 | 0.0 | 3.6 | 39.3 | [60.7 - 64.3] | [82.1 - 92.9] | 23 | |||
| 2024-06-01 | 36 | 18 | 0.0 | 11.1 | 30.6 | 50.0 | [66.7 - 72.2] | [75.0 - 86.1] | 27 | ||
| 2024-05-31 | 37 | 23 | 0.0 | 10.8 | 29.7 | 45.9 | 62.2 | [73.0 - 78.4] | [73.0 - 91.9] | 27 | |
| 2024-05-30 | 28 | 20 | 0.0 | 14.3 | 46.4 | 53.6 | 57.1 | 71.4 | [71.4 - 89.3] | 20 | |
We can take a closer look at 2024-06-03 calculations for the example using last data date 06/04 (MM/DD) with explanatory notes for select calculation cells. The detailed output is available by selecting option “2-day Prediction Range On with Details” in query request.
| Running 3-Days End Date (departure events >= 7) ▻ shaded red: Arrival on Avg (2) Day < 50% | Adult PIT Tag | ||||||||||
|---|---|---|---|---|---|---|---|---|---|---|---|
| Departure Events Ice Harbor for period | Lower Monumental Entry Events for Fish departing ICH during period viable for Cumulative Arrival % calculations | Cumulative Arrival Percent Lower Monumental Calendar Days after Ice Harbor Departure ▻ shaded gray: 50% arrival day ▻ shaded gold: ConRate < 85% (at least 7 fish; fallback, delay, wander, harvest, mortality can all attribute to <100%) ▻ shaded green: Prediction Range based on departures and detections for individual days included in 3-day cohort |
Total Lower Monumental Entry Events for Fish departing ICH during period | ||||||||
| 0 | 1 | 2 | 3 | 4 | 5 | 6 | Conversion Rate | ||||
|
❶ 2024-06-03 |
❷ 24 |
❸ 5 |
❹ 0.0 |
❺ 20.8 |
❻ [54.2 - 83.3] |
❼ [58.3 - 91.7] |
❽ 14 |
||||
|
This date represents the departure cohorts for 2024-06-03 and the prior 2 days: 2024-06-02 and 2024-06-01. That is, all individual PIT-tags departing the lower project on those 3 dates. Departures are cumulated for the 3 dates. |
Departures are accumulated for the 3 dates. All PIT-tags are unique and the last known departure for the individual PIT-tag. |
For all 3 dates, the number of detections at the upper project that are available for cumulative arrival percent calculations by calendar day. In this example, the only calendar. The last data date (maximum date of data) is 6/4. Calendar days possible for departure date: 6/3: 0,1 6/2: 0, 1, 2 6/1: 0, 1, 2, 3 All three departure dates are required for each calendar day calculation. Therefore, with data through 6/4, only calendar day 0 and 1 detections and accumulations are printed in the table. |
Cumulative detections by calendar day 0 for each departure date cohort divided by the cumulative departures divided by departure events ❷. |
Cumulative detections by calendar day 1 for each departure date cohort divided by the cumulative departures divided by departure events ❷. This is the maximum possible calendar day accumulation for this 3-day cohort. Therefore, it is ❸ divided by ❷. |
Predicted range calculations are possible for this cumulative arrival calendar day (2) because arrivals are possible for calendar day 2 for departure dates 6/2 and 6/1 (see possible calendar days in ❸ descriptive text). [54.2 - 83.3] The upper limit is the accumulated arrivals by Calendar Day 2 plus the possible new arrivals (number of departures for each date in cohort that have not, yet, arrived). 2024-06-01 depart. possible new arrivals: 0 |
Predicted range is possible because arrivals are possible for calendar day 3 for departure date 6/1. [58.3 - 91.7] The upper limit is the accumulated arrivals by Calendar Day 3 plus the possible new arrivals (number of departures for each date in cohort that have not, yet, arrived). 2024-06-01 depart. possible new arrivals: 0 |
Total arrivals at the upper project for the 3-day cohort through last data date. There is no restriction on “calendar day” arrival. |
||||
Criteria
Potential Delay conditions are identified by "dots" in the web output main figure and table cell shading based on criteria set by population and reach. The criteria for potential delay is that the Cumulative Arrival Percent is less than the arrival percent criterion value by the "Average" calendar days after departure to Arrive. The average travel days and arrival percent criterion are based on historical observations for each reach and population.
Criteria used in Daily and Running 3-Day Cohort Analysis of Reach Distribution and Travel Time.
| Lower Project | Upper Project | Date Range | Number of Reaches | Conversion Rate | Cumulative Arrival Percent | "Average" calendar days after departure to Arrive |
|---|---|---|---|---|---|---|
| Bonneville | Lower Granite | 4/3-6/20 | 7 | 65% | 40% | 15 |
| Bonneville | McNary | 4/3-6/20 | 3 | 70% | 40% | 7 |
| McNary | Ice Harbor | 4/3-6/20 | 1 | 85% | 50% | 2 |
| Ice Harbor | Lower Granite | 4/3-6/20 | 3 | 85% | 50% | 6 |
| Ice Harbor | Little Goose | 4/3-6/20 | 2 | 85% | 50% | 4 |
| Ice Harbor | Lower Monumental | 4/3-6/20 | 1 | 85% | 50% | 2 |
| Lower Monumental | Lower Granite | 4/3-6/20 | 2 | 85% | 50% | 4 |
| Lower Monumental | Little Goose | 4/3-6/20 | 1 | 85% | 50% | 2 |
| Little Goose | Lower Granite | 4/3-6/20 | 1 | 85% | 50% | 2 |
| Lower Project | Upper Project | Date Range | Number of Reaches | Conversion Rate | Cumulative Arrival Percent | "Average" calendar days after departure to Arrive |
|---|---|---|---|---|---|---|
| Bonneville | The Dalles | 4/10-6/15 | 1 | 80% | 45% | 3 |
| The Dalles | McNary | 4/10-6/15 | 2 | 80% | 45% | 4 |
| The Dalles | John Day | 4/10-6/15 | 1 | 80% | 45% | 2 |
| John Day | McNary | 4/10-6/15 | 1 | 85% | 50% | 3 |
Web Output Figures
Running 3-Day Travel Days and Run Size
Top: Daily analysis is smoothed by creating running 3-day calculations. The stacked Running 3-Day plot shows the cumulative arrival percent by days to arrive for each 3-day departure cohort.
- Potential delay conditions are highlighted by filled gray dots; the criteria for potential delay is that the Cumulative Arrival Percent of the 3-day cohort is less than the arrival percent criterion value by the "Average" travel days. The average travel days and arrival percent criterion are based on historical observations for each reach and population.
- The orange triangles represent the cumulative arrival percent by the "Average" travel day.
- Cumulative arrival percent for one day prior (blue stars) and one day after (purple diamonds) the average are presented for boundaries around the average day; the boundary days can highlight movement trends for the cohort.
- The gray pentagons represent the slow and final arrival percent which accumulates over the calendar year (conversion rate). Slow is defined as 5 or more days after "Average".
Middle: Percent of fish 'In Route' for each running 3-day cohort; complementary/inverse plot to the arrival YTD% (conversion rate) presented in top plot. Percent 'In Route' is reported immediately for the cohort. Note: Delay, fallback, wander, harvest, and mortality can all contribute to YTD Conversion Rate never reaching 100% and Percent 'In Route' never reaching 0%.
Bottom: Running 3-day PIT Tag departures plotted with running 3-day Adult Visual Counts for visual comparison of reach entry of the two data types.

Daily YTD Conversion Rate
Daily Year-to-Date (YTD) Conversion Rate for Adult PIT Tag and Adult Visual Count datasets. Visual comparison of trends between the two datasets. For each calendar day, the YTD Conversion Rate is calculated based on cumulative number of fish to date at the lower project and the cumulative number of fish to date at the upper project. There is no adjustment for travel time or harvest in these calculations.
Daily YTD Conversion Rate = cumulative total fish at upper to date / cumulative total fish at lower to date

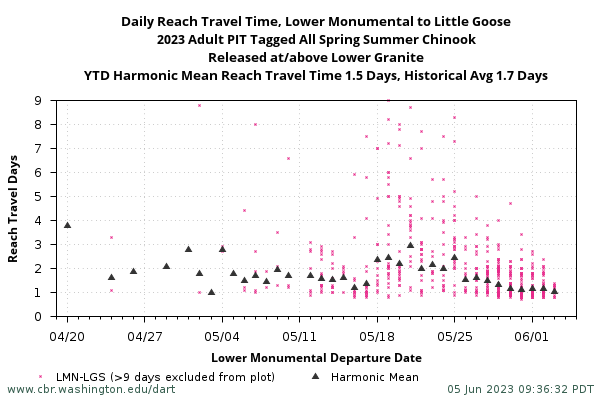
Daily Reach Travel Time
Adult PIT Tag Daily Reach Travel Time with Harmonic Mean Reach Travel Time for cohorts grouped by lower project departure date.
Harmonic Mean Travel Time = number of unique fish detected at the detection site / (  (1/reach travel time) )
When dealing with travel times, we are primarily interested in the speed with which fish travel from point A to point B. The harmonic mean is a good statistic for describing a particular group's speed. A harmonic mean is used when working with rates of speed, usually the number of days to travel a set distance. A benefit to using the harmonic mean is that it is more robust in the presence of outliers (i.e., a very fast or slow fish).
YTD Harmonic Mean Travel Time and Historical Average Reach Travel Time are presented as well.
Daily Conversion Rate
Daily Conversion Rate for Adult PIT Tag population grouped and tracked by lower project departure date within the selected period.
Departure Date Conversion Rate = total number of arrivals for fish based on TagID that departed lower project on date / total number of departures (not unique TagID) on date
Arrivals for all departure dates are updated daily throughout the year as fish arrive at the upper project. There is no date restriction on when the fish must arrive for inclusion. YTD Conversion Rate is calculated for unique TagIDs.
Note: Delay, fallback, wander, harvest, and mortality can all contribute to daily and YTD Conversion Rate never reaching 100%.

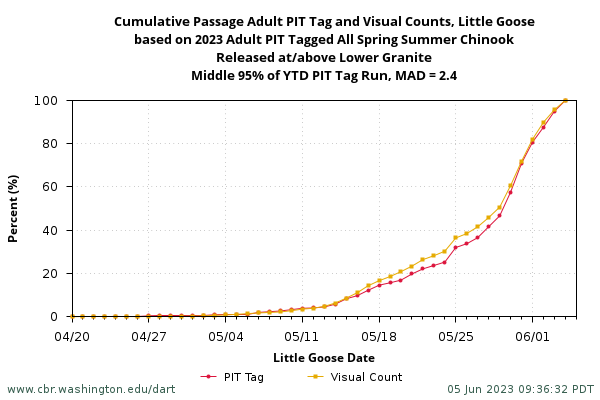
Cumulative Passage at the upper project for Adult PIT Tag and Adult Visual Counts
Cumulative Passage at the upper project for Adult PIT Tag and Adult Visual Counts is presented at the end of the season for movement comparison of the two datasets. Cumulative passage percent is calculated for both Adult PIT Tag (PIT) and Adult Visual Count (VC) populations at the upper project. To compare the cumulative passage of both datasets, MAD (mean absolute difference) is calculated for the middle 95% of the YTD Adult PIT Tag passage at the upper project. For each day in the middle 95% of the Adult PIT Tag run, mean absolute difference (MADj) is calculated and summed and the number of days is tallied.
MADseason = (|(cumPassagePITj - cumPassageVCj)| )/ number of days
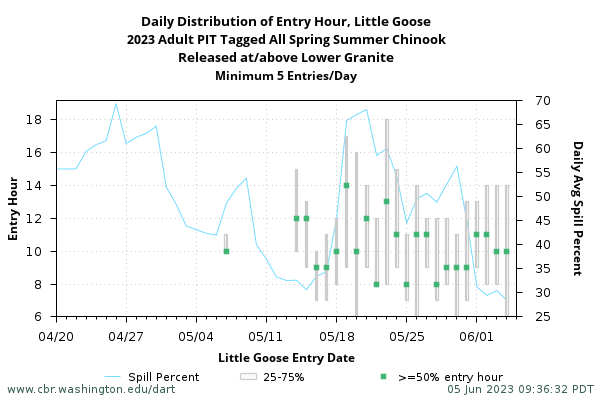
Daily Distribution of Entry Hour at upper project
Daily Entry Hour Distribution of Adult PIT Tag population and Spill Percent at the upper project, by calendar date. Arrivals at the upper project are tracked on a daily basis for entry hour. For each day's population, the distribution of entry hour is calculated for the hour when 25%, 50%, and 75% have entered. There is a required minimum of 5 entries/day set for calculations.
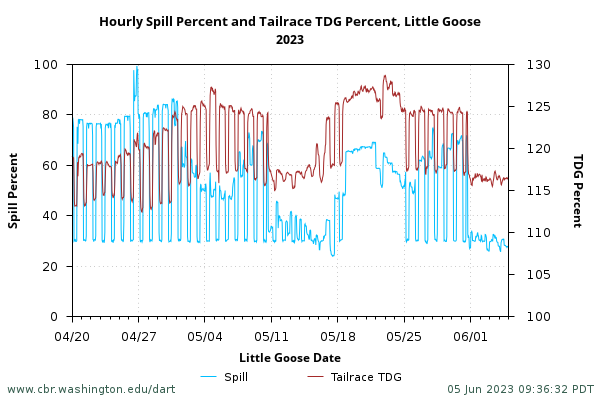
Hourly Spill Percent and Tailrace TDG Percent
Hourly Spill Percent and Tailrace TDG Percent for the upper project queried from the DART database.
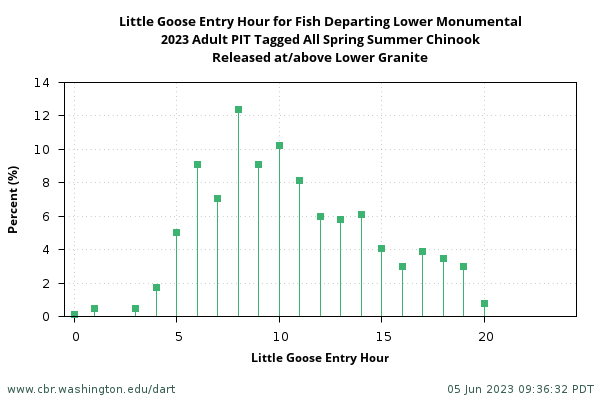
Upper Project Entry Hour
Entry hour distribution for Adult PIT Tag at the upper project for the whole period.
Glossary
The following are presented in the daily table (Daily Fish & Water) with a subset presented in the Running 3-Day table and in plots. The majority of analysis presented is tracked by departure date.
Adult PIT Tag Data for Fish Departing [lower], grouped by Departure Date
- Departure Events [lower]: Departure events
- [upper] Entry Events for Fish departing [lower]: Number of arrivals
- Unique TagIDs [lower]: Unique TagIDs in cohort. A difference between unique TagIDs and Departure Events indicates that 1 or more fish had a repeat ascent for the same date.
- Fish departing [lower] on date with history of >1 ascents: Number of TagIDs departing with multiple ascents, either on that date or prior dates.
- %Fish departing [lower] on date with history of >1 ascents: Percent of TagIDs departing with multiple ascents. The number departing with history >1 ascents divided by the number of Departure Events.
- Cumulative Arrival Percent [upper] Calendar Days after [lower] Departure: Arrivals at upper project by calendar days after departure, which can range from 0 (fast fish in a short reach, e.g., 5/15/2018 LMN->LGS) to over 100.
- Conversion Rate: number of arrivals / number of departure events.
There is no date restriction on arrival date at the upper project; conversion rates (daily and YTD) are updated throughout the calendar year.
Note: Delay, fallback, wander, harvest, and/or mortality can all contribute to daily and YTD Conversion Rate never reaching 100% and percent 'in route' never reaching 0% - Conversion Rate: number of arrivals / number of departure events.
- Harmonic Mean Reach TT (travel time)
- number of unique fish detected at the detection site / ( (1/reach travel time) )
When dealing with travel times, we are primarily interested in the speed with which fish travel from point A to point B. The harmonic mean is a good statistic for describing a particular group's speed. A harmonic mean is used when working with rates of speed, usually the number of days to travel a set distance. A benefit to using the harmonic mean is that it is more robust in the presence of outliers (i.e., a very fast or slow fish). - number of unique fish detected at the detection site / (
- Percent Not Arrived for period: Percent 'in route' (plot and running 3-day table).
- (departure events - number of arrivals) / departure events
There are several additional parameters that are tracked and presented by calendar date.
Other Data by Calendar Date
- Unique TagIDs Entry [upper] on calendar date for Fish departing [lower] during Period: Number of unique TagIDs at upper project of the query-qualifying TagIDs. This is the arrival distribution of the run as whole at the upper project by calendar date.
- Adult Visual Counts: Adult visual counts for lower and upper projects.
- MAD Adult PIT Tag and Visual Counts Cumulative Arrival % [upper]
Cumulative Passage at the upper project for Adult PIT Tag and Adult Visual Counts is presented at the end of the season for movement comparison of the two datasets. Cumulative passage percent is calculated for both Adult PIT Tag (PIT) and Adult Visual Count (VC) populations at the upper project.
To compare the cumulative passage of both datasets, MAD (mean absolute difference) is calculated for the middle 95% of the YTD Adult PIT Tag passage at the upper project.
For each day in the middle 95% of the Adult PIT Tag run, mean absolute difference (MADj) is calculated and summed and the number of days is tallied.
- MADseason = (|(cumPassagePITj - cumPassageVCj)| )/ number of days
- MADseason = (
- [upper] Hour of 50% Entry for date: Entry hour when 50% of fish for the date arrived. For some ladders and level of spill, there can be a noticeable impact on entry hour.
- Daily Averaged: Outflow, Spill, Spill%, Water Temperature (°C) tailrace, TDG (total dissolved gas) percent tailrace
- Min Elevation, Max Elevation (based on hourly measures)
- Hourly Spill percent and TDG percent (plot only)
Historical Statistics
| PIT Tagged Sp/Su Chinook released as Juveniles at/above McNary, Detected as Adult at Lower Project 4/10-6/15 | |||||||||||||||||||||||||||||||||||
| Reach | Year | Harmonic TT (days) | TT 90th Percentile (days) | Conversion Rate (no harvest adjustment) |
MAD Middle 95% of run | Detected at Lower Project |
Released Lower Snake 170601 |
Released Salmon 170602 |
Released Clearwater 170603 |
Released Upper Columbia 1702 |
Released Yakima 1703 |
Obs Date First |
Obs Date 5 Pct |
Obs Date 10 Pct |
Obs Date 50 Pct |
Obs Date 90 Pct |
Obs Date 95 Pct |
||||||||||||||||||
|---|---|---|---|---|---|---|---|---|---|---|---|---|---|---|---|---|---|---|---|---|---|---|---|---|---|---|---|---|---|---|---|---|---|---|---|
| BON-TDA | Average | 2.0 | median 3.25 range 2.2 - 4.7 |
88.9 | range 2.1 - 7.2 | 2205.9 | 12.7% | 27.9% | 19.2% | 29.8% | 9.9% | ||||||||||||||||||||||||
| 2025 | 2.2 | 2.2 | 12.5 | 8 | 0.0% | 25.0% | 12.5% | 25.0% | 0.0% | 04/11 | 04/11 | 04/11 | 04/16 | 04/16 | 04/16 | ||||||||||||||||||||
| 2024 | 1.8 | 2.7 | 92.7 | 3.7 | 2113 | 18.7% | 24.1% | 18.8% | 30.6% | 7.2% | 04/12 | 04/25 | 04/29 | 05/13 | 06/11 | 06/13 | |||||||||||||||||||
| 2023 | 2.1 | 3.9 | 89.2 | 4.7 | 2388 | 9.2% | 26.4% | 18.8% | 38.7% | 6.6% | 04/12 | 04/30 | 05/04 | 05/19 | 06/12 | 06/14 | |||||||||||||||||||
| 2022 | 2.1 | 3.6 | 88.3 | 3.0 | 2989 | 10.2% | 30.7% | 19.4% | 32.6% | 6.1% | 04/15 | 04/26 | 04/28 | 05/14 | 06/08 | 06/11 | |||||||||||||||||||
| 2021 | 1.8 | 2.9 | 91.0 | 6.0 | 1582 | 15.0% | 29.5% | 9.4% | 35.9% | 9.7% | 04/13 | 04/28 | 04/30 | 05/17 | 06/10 | 06/13 | |||||||||||||||||||
| 2020 | 2.1 | 3.5 | 89.0 | 7.2 | 1087 | 13.6% | 24.6% | 12.1% | 39.0% | 10.3% | 04/10 | 04/29 | 05/01 | 05/22 | 06/11 | 06/14 | |||||||||||||||||||
| 2019 | 2.0 | 3.3 | 87.8 | 3.7 | 1239 | 11.0% | 23.2% | 13.5% | 41.4% | 10.5% | 04/14 | 05/01 | 05/03 | 05/18 | 06/12 | 06/14 | |||||||||||||||||||
| 2018 | 2.4 | 4.7 | 84.6 | 4.2 | 1464 | 10.1% | 27.0% | 24.1% | 28.3% | 10.2% | 04/15 | 05/02 | 05/05 | 05/20 | 06/09 | 06/12 | |||||||||||||||||||
| 2017 | 2.5 | 4.3 | 83.1 | 3.7 | 1386 | 12.8% | 25.8% | 21.5% | 25.2% | 14.5% | 04/17 | 05/04 | 05/06 | 05/23 | 06/09 | 06/12 | |||||||||||||||||||
| 2016 | 1.8 | 2.8 | 89.4 | 4.2 | 2153 | 13.6% | 31.6% | 23.6% | 20.9% | 9.4% | 04/10 | 04/23 | 04/29 | 05/12 | 06/09 | 06/12 | |||||||||||||||||||
| 2015 | 1.6 | 2.2 | 90.4 | 3.4 | 3804 | 13.0% | 35.3% | 25.0% | 17.4% | 8.8% | 04/10 | 04/18 | 04/19 | 05/07 | 06/09 | 06/12 | |||||||||||||||||||
| 2014 | 2.1 | 3.2 | 87.6 | 2.1 | 3631 | 12.6% | 31.2% | 22.6% | 19.1% | 14.1% | 04/10 | 04/20 | 04/25 | 05/09 | 06/08 | 06/12 | |||||||||||||||||||
| 2013 | 2.0 | 3.0 | 93.7 | 2.9 | 2635 | 12.4% | 25.3% | 21.6% | 28.0% | 12.0% | 04/10 | 04/26 | 04/27 | 05/13 | 06/12 | 06/14 | |||||||||||||||||||
| BON-MCN triple reach | Average | 6.2 | median 9.6 range 6.9 - 13.3 |
82.3 | range 1.3 - 9.5 | 2621.9 | 13.4% | 29.6% | 19.6% | 26.5% | 10.3% | ||||||||||||||||||||||||
| 2025 | 0 | 0.0 | 13 | 0.0% | 23.1% | 7.7% | 30.8% | 0.0% | 04/11 | 04/11 | 04/11 | 04/16 | 04/17 | 04/17 | |||||||||||||||||||||
| 2024 | 5.6 | 8.9 | 87.6 | 3.7 | 2113 | 18.7% | 24.1% | 18.8% | 30.6% | 7.2% | 04/12 | 04/25 | 04/29 | 05/13 | 06/11 | 06/13 | |||||||||||||||||||
| 2023 | 6.2 | 9.6 | 82.9 | 4.1 | 2388 | 9.2% | 26.4% | 18.8% | 38.7% | 6.6% | 04/12 | 04/30 | 05/04 | 05/19 | 06/12 | 06/14 | |||||||||||||||||||
| 2022 | 6.3 | 11.8 | 81.2 | 6.7 | 2989 | 10.2% | 30.7% | 19.4% | 32.6% | 6.1% | 04/15 | 04/26 | 04/28 | 05/14 | 06/08 | 06/11 | |||||||||||||||||||
| 2021 | 5.7 | 9.0 | 85.3 | 4.5 | 1579 | 15.0% | 29.4% | 9.4% | 36.0% | 9.8% | 04/13 | 04/28 | 04/30 | 05/17 | 06/10 | 06/13 | |||||||||||||||||||
| 2020 | 6.5 | 10.3 | 82.0 | 3.7 | 1087 | 13.6% | 24.6% | 12.1% | 39.0% | 10.3% | 04/10 | 04/29 | 05/01 | 05/22 | 06/11 | 06/14 | |||||||||||||||||||
| 2019 | 6.1 | 9.3 | 81.4 | 2.1 | 1239 | 11.0% | 23.2% | 13.5% | 41.4% | 10.5% | 04/14 | 05/01 | 05/03 | 05/18 | 06/12 | 06/14 | |||||||||||||||||||
| 2018 | 6.7 | 10.5 | 77.2 | 2.3 | 1463 | 10.1% | 27.0% | 24.1% | 28.4% | 10.2% | 04/15 | 05/02 | 05/05 | 05/20 | 06/09 | 06/12 | |||||||||||||||||||
| 2017 | 6.6 | 10.3 | 78.5 | 3.9 | 1386 | 12.8% | 25.8% | 21.5% | 25.2% | 14.5% | 04/17 | 05/04 | 05/06 | 05/23 | 06/09 | 06/12 | |||||||||||||||||||
| 2016 | 5.4 | 8.2 | 82.5 | 2.8 | 2153 | 13.6% | 31.6% | 23.6% | 20.9% | 9.4% | 04/10 | 04/23 | 04/29 | 05/12 | 06/09 | 06/12 | |||||||||||||||||||
| 2015 | 4.9 | 6.9 | 79.9 | 1.8 | 3803 | 12.9% | 35.3% | 25.0% | 17.4% | 8.8% | 04/10 | 04/18 | 04/19 | 05/07 | 06/09 | 06/12 | |||||||||||||||||||
| 2014 | 6.1 | 9.2 | 80.3 | 2.6 | 3631 | 12.6% | 31.2% | 22.6% | 19.1% | 14.1% | 04/10 | 04/20 | 04/25 | 05/09 | 06/08 | 06/12 | |||||||||||||||||||
| 2013 | 5.9 | 9.6 | 88.0 | 1.6 | 2635 | 12.4% | 25.3% | 21.6% | 28.0% | 12.0% | 04/10 | 04/26 | 04/27 | 05/13 | 06/12 | 06/14 | |||||||||||||||||||
| 2012 | 6.5 | 10.1 | 82.4 | 1.4 | 3149 | 15.9% | 25.2% | 27.3% | 22.1% | 8.6% | 04/12 | 04/24 | 04/30 | 05/13 | 06/07 | 06/12 | |||||||||||||||||||
| 2011 | 6.9 | 12.3 | 79.2 | 2.1 | 4707 | 19.5% | 30.5% | 23.3% | 14.3% | 11.5% | 04/12 | 04/28 | 04/30 | 05/12 | 06/10 | 06/12 | |||||||||||||||||||
| 2010 | 5.5 | 8.2 | 80.9 | 1.8 | 5395 | 18.0% | 43.7% | 16.9% | 8.5% | 11.8% | 04/10 | 04/15 | 04/17 | 05/04 | 06/02 | 06/07 | |||||||||||||||||||
| 2009 | 5.8 | 8.8 | 85.9 | 3.5 | 3925 | 17.9% | 45.1% | 19.2% | 5.3% | 12.2% | 04/10 | 04/26 | 05/01 | 05/15 | 06/09 | 06/12 | |||||||||||||||||||
| 2008 | 6.7 | 12.2 | 80.2 | 1.3 | 2773 | 13.1% | 40.2% | 29.9% | 7.3% | 9.2% | 04/10 | 04/20 | 04/26 | 05/13 | 06/09 | 06/12 | |||||||||||||||||||
| 2007 | 6.5 | 12.0 | 87.3 | 9.5 | 1415 | 10.2% | 30.3% | 17.0% | 31.9% | 9.4% | 04/11 | 04/19 | 04/24 | 05/19 | 06/12 | 06/14 | |||||||||||||||||||
| 2006 | 7.2 | 13.3 | 81.8 | 3.2 | 1987 | 7.1% | 13.7% | 9.0% | 56.2% | 13.4% | 04/13 | 04/30 | 05/02 | 05/13 | 06/12 | 06/14 | |||||||||||||||||||
| TDA-JDA | Average | 1.2 | median 3.0 range 2.6 - 3.9 |
94.2 | range 2.8 - 7.4 | 1605.3 | 12.8% | 27.0% | 16.4% | 34.2% | 9.1% | ||||||||||||||||||||||||
| 2025 | 6.4 | 6.4 | 50.0 | 2 | 0.0% | 0.0% | 0.0% | 0.0% | 50.0% | 04/11 | 04/11 | 04/11 | 04/11 | 04/15 | 04/15 | ||||||||||||||||||||
| 2024 | 1.2 | 2.6 | 96.1 | 3.3 | 1964 | 19.9% | 24.5% | 18.7% | 29.2% | 7.1% | 04/10 | 04/26 | 05/01 | 05/14 | 06/11 | 06/13 | |||||||||||||||||||
| 2023 | 1.3 | 3.0 | 94.1 | 3.6 | 2060 | 9.6% | 27.9% | 17.7% | 37.4% | 7.1% | 04/12 | 05/02 | 05/09 | 05/23 | 06/12 | 06/14 | |||||||||||||||||||
| 2022 | 1.2 | 3.2 | 94.1 | 2.8 | 2593 | 10.2% | 30.9% | 19.5% | 31.9% | 6.3% | 04/10 | 04/27 | 04/30 | 05/15 | 06/08 | 06/12 | |||||||||||||||||||
| 2021 | 1.2 | 2.9 | 95.0 | 5.7 | 1438 | 14.7% | 30.1% | 10.0% | 34.1% | 10.6% | 04/14 | 04/29 | 05/01 | 05/18 | 06/11 | 06/13 | |||||||||||||||||||
| 2020 | 1.3 | 3.9 | 94.7 | 7.4 | 923 | 14.0% | 25.1% | 12.4% | 37.4% | 11.1% | 04/13 | 04/30 | 05/03 | 05/21 | 06/10 | 06/13 | |||||||||||||||||||
| 2019 | 1.2 | 3.0 | 92.7 | 4.8 | 1052 | 11.0% | 24.2% | 12.5% | 40.5% | 11.4% | 04/20 | 05/04 | 05/06 | 05/20 | 06/12 | 06/14 | |||||||||||||||||||
| 2018 | 1.2 | 2.7 | 92.7 | 4.6 | 1207 | 10.3% | 26.3% | 24.2% | 29.1% | 9.9% | 04/12 | 05/05 | 05/07 | 05/23 | 06/10 | 06/12 | |||||||||||||||||||
| TDA-MCN double reach | Average | 3.7 | median 6.1 range 4.7 - 8.0 |
92.5 | range 1.6 - 5.8 | 1942.2 | 13.0% | 28.1% | 19.0% | 29.1% | 10.3% | ||||||||||||||||||||||||
| 2025 | 0 | 0.0 | 2 | 0.0% | 0.0% | 0.0% | 0.0% | 50.0% | 04/11 | 04/11 | 04/11 | 04/11 | 04/15 | 04/15 | |||||||||||||||||||||
| 2024 | 3.6 | 6.1 | 95.0 | 2.5 | 1964 | 19.9% | 24.5% | 18.7% | 29.2% | 7.1% | 04/10 | 04/26 | 05/01 | 05/14 | 06/11 | 06/13 | |||||||||||||||||||
| 2023 | 3.9 | 6.0 | 92.7 | 3.2 | 2060 | 9.6% | 27.9% | 17.7% | 37.4% | 7.1% | 04/12 | 05/02 | 05/09 | 05/23 | 06/12 | 06/14 | |||||||||||||||||||
| 2022 | 4.0 | 8.0 | 92.3 | 4.2 | 2593 | 10.2% | 30.9% | 19.5% | 31.9% | 6.3% | 04/10 | 04/27 | 04/30 | 05/15 | 06/08 | 06/12 | |||||||||||||||||||
| 2021 | 3.7 | 6.2 | 93.9 | 4.3 | 1438 | 14.7% | 30.1% | 10.0% | 34.1% | 10.6% | 04/14 | 04/29 | 05/01 | 05/18 | 06/11 | 06/13 | |||||||||||||||||||
| 2020 | 4.2 | 7.1 | 92.6 | 5.8 | 923 | 14.0% | 25.1% | 12.4% | 37.4% | 11.1% | 04/13 | 04/30 | 05/03 | 05/21 | 06/10 | 06/13 | |||||||||||||||||||
| 2019 | 3.8 | 6.2 | 93.0 | 3.7 | 1052 | 11.0% | 24.2% | 12.5% | 40.5% | 11.4% | 04/20 | 05/04 | 05/06 | 05/20 | 06/12 | 06/14 | |||||||||||||||||||
| 2018 | 3.9 | 6.1 | 90.7 | 3.6 | 1207 | 10.3% | 26.3% | 24.2% | 29.1% | 9.9% | 04/12 | 05/05 | 05/07 | 05/23 | 06/10 | 06/12 | |||||||||||||||||||
| 2017 | 3.8 | 6.0 | 93.5 | 5.2 | 1141 | 13.8% | 25.4% | 20.3% | 25.0% | 15.1% | 04/16 | 05/07 | 05/11 | 05/26 | 06/09 | 06/12 | |||||||||||||||||||
| 2016 | 3.5 | 5.7 | 92.2 | 3.9 | 1901 | 13.8% | 32.0% | 22.7% | 20.8% | 9.7% | 04/10 | 04/27 | 05/01 | 05/14 | 06/09 | 06/12 | |||||||||||||||||||
| 2015 | 3.2 | 4.7 | 89.0 | 1.6 | 3516 | 13.1% | 34.6% | 25.6% | 17.1% | 9.0% | 04/10 | 04/19 | 04/21 | 05/05 | 06/09 | 06/13 | |||||||||||||||||||
| 2014 | 3.7 | 6.1 | 91.8 | 3.4 | 3143 | 12.2% | 30.5% | 22.7% | 19.9% | 14.3% | 04/10 | 04/24 | 04/28 | 05/11 | 06/09 | 06/12 | |||||||||||||||||||
| 2013 | 3.6 | 6.3 | 93.9 | 4.7 | 2368 | 12.9% | 25.9% | 21.9% | 26.7% | 11.9% | 04/12 | 04/27 | 04/29 | 05/13 | 06/12 | 06/14 | |||||||||||||||||||
| JDA-MCN | Average | 2.4 | median 3.3 range 3.3 - 4.0 |
97.8 | range 2.6 - 7.3 | 1442.9 | 13.2% | 27.7% | 17.1% | 32.8% | 8.8% | ||||||||||||||||||||||||
| 2025 | 0 | 0.0 | 1 | 0.0% | 0.0% | 0.0% | 0.0% | 100.0% | 04/17 | 04/17 | 04/17 | 04/17 | 04/17 | 04/17 | |||||||||||||||||||||
| 2024 | 2.3 | 3.3 | 98.2 | 2.6 | 1816 | 20.5% | 24.3% | 19.1% | 28.4% | 7.1% | 04/13 | 04/28 | 05/03 | 05/15 | 06/11 | 06/13 | |||||||||||||||||||
| 2023 | 2.3 | 3.3 | 97.6 | 3.3 | 1839 | 9.7% | 28.5% | 18.5% | 35.7% | 7.2% | 04/14 | 05/05 | 05/11 | 05/24 | 06/12 | 06/14 | |||||||||||||||||||
| 2022 | 2.5 | 4.0 | 97.4 | 2.7 | 2316 | 10.5% | 32.0% | 20.2% | 29.8% | 6.3% | 04/15 | 04/29 | 05/01 | 05/16 | 06/07 | 06/11 | |||||||||||||||||||
| 2021 | 2.3 | 3.3 | 98.9 | 4.9 | 1313 | 14.6% | 31.1% | 10.4% | 33.1% | 10.4% | 04/10 | 05/01 | 05/02 | 05/18 | 06/11 | 06/13 | |||||||||||||||||||
| 2020 | 2.5 | 3.7 | 97.4 | 3.0 | 819 | 14.7% | 26.1% | 12.9% | 35.2% | 11.0% | 04/17 | 05/01 | 05/04 | 05/20 | 06/11 | 06/13 | |||||||||||||||||||
| 2019 | 2.4 | 3.4 | 98.5 | 7.3 | 917 | 12.0% | 25.0% | 13.1% | 39.4% | 10.3% | 04/19 | 05/05 | 05/07 | 05/20 | 06/10 | 06/13 | |||||||||||||||||||
| 2018 | 2.4 | 3.3 | 96.9 | 5.3 | 1080 | 10.2% | 26.9% | 25.4% | 27.9% | 9.5% | 04/15 | 05/06 | 05/09 | 05/24 | 06/10 | 06/13 | |||||||||||||||||||
| PIT Tagged Sp/Su Chinook released as Juveniles at/above Lower Granite with Unknown-run tagged at LWG in April and May in same year as release, Detected as Adult at Lower Project 4/3-6/20 | |||||||||||||||||||||||||||||||||||
| Reach | Year | Harmonic TT (days) | TT 90th Percentile (days) | Conversion Rate (no harvest adjustment) |
MAD Middle 95% of run | Detected at Lower Project |
Released Lower Snake 170601 |
Released Salmon 170602 |
Released Clearwater 170603 |
Released Upper Columbia 1702 |
Released Yakima 1703 |
Obs Date First |
Obs Date 5 Pct |
Obs Date 10 Pct |
Obs Date 50 Pct |
Obs Date 90 Pct |
Obs Date 95 Pct |
||||||||||||||||||
| BON-LWG all reaches, snake only | Average | 14.0 | median 21.7 range 16.9 - 36.8 |
76.3 | range 1.1 - 8.8 | 2150.8 | 29.6% | 43.0% | 27.4% | 0.0% | 0.0% | ||||||||||||||||||||||||
| 2025 | 0 | 0.0 | 6 | 16.7% | 66.7% | 16.7% | 04/09 | 04/09 | 04/09 | 04/11 | 04/17 | 04/17 | |||||||||||||||||||||||
| 2024 | 12.8 | 21.1 | 80.4 | 6.4 | 1236 | 22.7% | 44.5% | 32.8% | 04/08 | 04/25 | 04/30 | 05/13 | 06/12 | 06/16 | |||||||||||||||||||||
| 2023 | 13.7 | 21.6 | 80.3 | 4.7 | 1331 | 15.4% | 50.5% | 34.1% | 04/04 | 04/29 | 05/03 | 05/16 | 06/10 | 06/14 | |||||||||||||||||||||
| 2022 | 15.9 | 27.0 | 75.8 | 5.9 | 1871 | 17.5% | 51.1% | 31.3% | 04/06 | 04/25 | 04/28 | 05/13 | 06/08 | 06/13 | |||||||||||||||||||||
| 2021 | 11.9 | 19.7 | 80.5 | 5.5 | 958 | 32.8% | 51.4% | 15.9% | 04/07 | 04/28 | 04/30 | 05/15 | 06/11 | 06/16 | |||||||||||||||||||||
| 2020 | 15.2 | 24.0 | 77.0 | 4.8 | 677 | 39.0% | 41.7% | 19.4% | 04/10 | 04/28 | 04/30 | 05/16 | 06/10 | 06/15 | |||||||||||||||||||||
| 2019 | 14.8 | 30.1 | 74.4 | 4.2 | 632 | 26.6% | 46.8% | 26.6% | 04/06 | 04/30 | 05/02 | 05/13 | 06/07 | 06/13 | |||||||||||||||||||||
| 2018 | 14.8 | 24.1 | 72.7 | 6.3 | 946 | 18.1% | 44.4% | 37.5% | 04/15 | 05/02 | 05/05 | 05/20 | 06/09 | 06/13 | |||||||||||||||||||||
| 2017 | 15.9 | 25.0 | 73.0 | 3.8 | 868 | 21.5% | 43.3% | 35.1% | 04/07 | 05/04 | 05/05 | 05/23 | 06/09 | 06/14 | |||||||||||||||||||||
| 2016 | 11.8 | 19.5 | 76.9 | 4.5 | 1653 | 25.7% | 42.8% | 31.5% | 04/03 | 04/22 | 04/29 | 05/11 | 06/08 | 06/12 | |||||||||||||||||||||
| 2015 | 11.3 | 16.9 | 72.5 | 6.0 | 3139 | 22.9% | 46.0% | 31.2% | 04/03 | 04/17 | 04/19 | 05/09 | 06/11 | 06/16 | |||||||||||||||||||||
| 2014 | 13.1 | 20.7 | 74.8 | 3.5 | 2697 | 24.3% | 44.4% | 31.3% | 04/03 | 04/20 | 04/24 | 05/09 | 06/10 | 06/14 | |||||||||||||||||||||
| 2013 | 12.1 | 19.0 | 83.3 | 3.0 | 1789 | 27.1% | 40.6% | 32.3% | 04/03 | 04/24 | 04/26 | 05/10 | 06/12 | 06/16 | |||||||||||||||||||||
| 2012 | 13.4 | 21.7 | 75.1 | 2.2 | 2658 | 36.2% | 31.5% | 32.3% | 04/09 | 04/23 | 04/26 | 05/12 | 06/07 | 06/14 | |||||||||||||||||||||
| 2011 | 17.5 | 36.8 | 70.1 | 2.2 | 4541 | 42.5% | 33.4% | 24.1% | 04/03 | 04/27 | 04/30 | 05/12 | 06/12 | 06/16 | |||||||||||||||||||||
| 2010 | 14.1 | 21.7 | 74.2 | 1.7 | 6240 | 45.3% | 39.9% | 14.8% | 04/03 | 04/15 | 04/17 | 05/06 | 06/08 | 06/15 | |||||||||||||||||||||
| 2009 | 12.4 | 19.6 | 80.7 | 1.1 | 4439 | 40.4% | 42.5% | 17.1% | 04/03 | 04/26 | 05/01 | 05/17 | 06/13 | 06/16 | |||||||||||||||||||||
| 2008 | 15.3 | 24.2 | 76.1 | 1.4 | 3438 | 40.9% | 34.8% | 24.3% | 04/03 | 04/19 | 04/26 | 05/13 | 06/12 | 06/16 | |||||||||||||||||||||
| 2007 | 13.4 | 23.7 | 80.9 | 4.3 | 1054 | 32.5% | 44.6% | 22.9% | 04/04 | 04/20 | 04/25 | 05/15 | 06/12 | 06/17 | |||||||||||||||||||||
| 2006 | 16.1 | 30.1 | 71.9 | 8.8 | 698 | 31.9% | 42.4% | 25.6% | 04/24 | 04/30 | 05/04 | 05/15 | 06/13 | 06/16 | |||||||||||||||||||||
| BON-MCN triple reach, snake only | Average | 6.0 | median 9.2 range 7.0 - 12.7 |
80.7 | range 1.5 - 15.5 | 2151.3 | 29.6% | 43.0% | 27.4% | 0.0% | 0.0% | ||||||||||||||||||||||||
| 2025 | 0 | 0.0 | 6 | 16.7% | 66.7% | 16.7% | 04/09 | 04/09 | 04/09 | 04/11 | 04/17 | 04/17 | |||||||||||||||||||||||
| 2024 | 5.4 | 8.8 | 85.8 | 3.7 | 1236 | 22.7% | 44.5% | 32.8% | 04/08 | 04/25 | 04/30 | 05/13 | 06/12 | 06/16 | |||||||||||||||||||||
| 2023 | 6.2 | 9.7 | 82.0 | 5.6 | 1331 | 15.4% | 50.5% | 34.1% | 04/04 | 04/29 | 05/03 | 05/16 | 06/10 | 06/14 | |||||||||||||||||||||
| 2022 | 6.1 | 9.9 | 80.3 | 3.0 | 1871 | 17.5% | 51.1% | 31.3% | 04/06 | 04/25 | 04/28 | 05/13 | 06/08 | 06/13 | |||||||||||||||||||||
| 2021 | 5.4 | 8.4 | 84.4 | 9.1 | 959 | 32.7% | 51.4% | 15.8% | 04/07 | 04/28 | 04/30 | 05/15 | 06/11 | 06/16 | |||||||||||||||||||||
| 2020 | 6.1 | 9.1 | 80.8 | 15.5 | 677 | 39.0% | 41.7% | 19.4% | 04/10 | 04/28 | 04/30 | 05/16 | 06/10 | 06/15 | |||||||||||||||||||||
| 2019 | 5.9 | 9.2 | 78.0 | 13.3 | 632 | 26.6% | 46.8% | 26.6% | 04/06 | 04/30 | 05/02 | 05/13 | 06/07 | 06/13 | |||||||||||||||||||||
| 2018 | 6.5 | 10.0 | 76.2 | 8.2 | 946 | 18.1% | 44.4% | 37.5% | 04/15 | 05/02 | 05/05 | 05/20 | 06/09 | 06/13 | |||||||||||||||||||||
| 2017 | 6.3 | 9.4 | 76.7 | 9.6 | 868 | 21.5% | 43.3% | 35.1% | 04/07 | 05/04 | 05/05 | 05/23 | 06/09 | 06/14 | |||||||||||||||||||||
| 2016 | 5.4 | 8.6 | 81.4 | 8.6 | 1653 | 25.7% | 42.8% | 31.5% | 04/03 | 04/22 | 04/29 | 05/11 | 06/08 | 06/12 | |||||||||||||||||||||
| 2015 | 4.9 | 7.0 | 77.7 | 1.8 | 3139 | 22.9% | 46.0% | 31.2% | 04/03 | 04/17 | 04/19 | 05/09 | 06/11 | 06/16 | |||||||||||||||||||||
| 2014 | 5.8 | 8.9 | 77.9 | 6.2 | 2697 | 24.3% | 44.4% | 31.3% | 04/03 | 04/20 | 04/24 | 05/09 | 06/10 | 06/14 | |||||||||||||||||||||
| 2013 | 5.6 | 9.0 | 86.7 | 10.3 | 1789 | 27.1% | 40.6% | 32.3% | 04/03 | 04/24 | 04/26 | 05/10 | 06/12 | 06/16 | |||||||||||||||||||||
| 2012 | 6.4 | 9.9 | 80.3 | 4.7 | 2661 | 36.2% | 31.5% | 32.4% | 04/09 | 04/23 | 04/26 | 05/12 | 06/07 | 06/14 | |||||||||||||||||||||
| 2011 | 6.8 | 12.1 | 76.6 | 1.6 | 4546 | 42.5% | 33.3% | 24.2% | 04/03 | 04/27 | 04/30 | 05/12 | 06/12 | 06/15 | |||||||||||||||||||||
| 2010 | 5.5 | 8.6 | 79.0 | 1.5 | 6240 | 45.3% | 39.9% | 14.8% | 04/03 | 04/15 | 04/17 | 05/05 | 06/08 | 06/15 | |||||||||||||||||||||
| 2009 | 5.7 | 8.9 | 85.0 | 3.4 | 4439 | 40.4% | 42.5% | 17.1% | 04/03 | 04/26 | 05/01 | 05/17 | 06/13 | 06/16 | |||||||||||||||||||||
| 2008 | 6.6 | 12.1 | 79.3 | 2.7 | 3438 | 40.9% | 34.8% | 24.3% | 04/03 | 04/19 | 04/26 | 05/13 | 06/12 | 06/16 | |||||||||||||||||||||
| 2007 | 5.9 | 10.2 | 86.1 | 4.2 | 1054 | 32.5% | 44.6% | 22.9% | 04/04 | 04/20 | 04/25 | 05/15 | 06/12 | 06/17 | |||||||||||||||||||||
| 2006 | 6.9 | 12.7 | 79.4 | 6.3 | 698 | 31.9% | 42.4% | 25.6% | 04/24 | 04/30 | 05/04 | 05/15 | 06/13 | 06/16 | |||||||||||||||||||||
| MCN-IHR, snake only | Average | 1.8 | median 3.7 range 2.3 - 6.1 |
96.3 | range 1.1 - 7.0 | 1649.0 | 29.1% | 43.0% | 27.9% | 0.0% | 0.0% | ||||||||||||||||||||||||
| 2025 | 0 | 0.0 | 1 | 0.0% | 100.0% | 0.0% | 04/09 | 04/09 | 04/09 | 04/09 | 04/09 | 04/09 | |||||||||||||||||||||||
| 2024 | 1.8 | 3.4 | 94.3 | 3.6 | 1048 | 23.1% | 43.7% | 33.2% | 04/18 | 05/01 | 05/06 | 05/17 | 06/14 | 06/17 | |||||||||||||||||||||
| 2023 | 1.9 | 5.0 | 94.9 | 5.4 | 1058 | 15.5% | 52.2% | 32.3% | 04/09 | 05/08 | 05/14 | 05/26 | 06/15 | 06/18 | |||||||||||||||||||||
| 2022 | 2.1 | 6.1 | 95.2 | 2.8 | 1448 | 17.1% | 51.6% | 31.4% | 04/05 | 05/01 | 05/03 | 05/17 | 06/10 | 06/15 | |||||||||||||||||||||
| 2021 | 1.5 | 2.3 | 98.3 | 4.3 | 786 | 30.7% | 52.4% | 16.9% | 04/13 | 05/03 | 05/04 | 05/20 | 06/13 | 06/16 | |||||||||||||||||||||
| 2020 | 1.9 | 3.9 | 96.7 | 4.4 | 516 | 37.0% | 42.6% | 20.3% | 04/20 | 05/03 | 05/06 | 05/20 | 06/12 | 06/16 | |||||||||||||||||||||
| 2019 | 1.7 | 3.0 | 98.4 | 2.8 | 487 | 26.7% | 48.7% | 24.6% | 04/18 | 05/07 | 05/09 | 05/20 | 06/12 | 06/16 | |||||||||||||||||||||
| 2018 | 2.0 | 3.8 | 97.1 | 7.0 | 700 | 18.9% | 42.6% | 38.6% | 05/02 | 05/10 | 05/12 | 05/27 | 06/13 | 06/16 | |||||||||||||||||||||
| 2017 | 2.0 | 4.0 | 95.7 | 4.9 | 646 | 22.0% | 44.3% | 33.7% | 05/05 | 05/12 | 05/14 | 05/29 | 06/13 | 06/16 | |||||||||||||||||||||
| 2016 | 1.6 | 2.9 | 97.4 | 3.4 | 1299 | 26.8% | 42.1% | 31.1% | 04/08 | 04/30 | 05/05 | 05/15 | 06/12 | 06/15 | |||||||||||||||||||||
| 2015 | 1.5 | 2.9 | 98.0 | 3.8 | 2429 | 22.1% | 44.3% | 33.6% | 04/05 | 04/22 | 04/24 | 05/07 | 06/13 | 06/16 | |||||||||||||||||||||
| 2014 | 1.8 | 3.3 | 97.6 | 3.1 | 2014 | 23.7% | 43.5% | 32.7% | 04/04 | 04/28 | 05/01 | 05/14 | 06/12 | 06/16 | |||||||||||||||||||||
| 2013 | 1.6 | 3.0 | 97.9 | 3.4 | 1457 | 26.6% | 40.2% | 33.2% | 04/03 | 04/30 | 05/02 | 05/15 | 06/14 | 06/18 | |||||||||||||||||||||
| 2012 | 1.8 | 3.1 | 96.4 | 1.4 | 2077 | 35.7% | 30.3% | 33.9% | 04/19 | 05/06 | 05/11 | 05/18 | 06/09 | 06/14 | |||||||||||||||||||||
| 2011 | 2.1 | 4.8 | 90.4 | 1.5 | 3197 | 39.0% | 32.7% | 28.3% | 04/20 | 05/04 | 05/06 | 05/16 | 06/15 | 06/17 | |||||||||||||||||||||
| 2010 | 1.8 | 4.2 | 96.2 | 3.1 | 4738 | 45.6% | 39.8% | 14.6% | 04/03 | 04/21 | 04/23 | 05/10 | 06/09 | 06/14 | |||||||||||||||||||||
| 2009 | 1.7 | 3.7 | 96.2 | 1.1 | 3564 | 39.3% | 43.2% | 17.5% | 04/16 | 05/05 | 05/08 | 05/21 | 06/15 | 06/17 | |||||||||||||||||||||
| 2008 | 2.0 | 5.1 | 96.8 | 2.2 | 2502 | 40.7% | 35.5% | 23.9% | 04/06 | 04/28 | 05/04 | 05/19 | 06/16 | 06/18 | |||||||||||||||||||||
| 2007 | 1.7 | 3.0 | 97.6 | 6.7 | 869 | 32.7% | 43.3% | 24.1% | 04/18 | 04/29 | 05/02 | 05/18 | 06/13 | 06/17 | |||||||||||||||||||||
| 2006 | 1.9 | 3.8 | 94.8 | 4.8 | 496 | 30.4% | 43.5% | 26.0% | 05/01 | 05/08 | 05/11 | 05/20 | 06/15 | 06/17 | |||||||||||||||||||||
| IHR-LMN | Average | 1.4 | median 2.8 range 2.0 - 5.7 |
98.5 | range 1.4 - 6.3 | 1063.2 | 23.9% | 45.6% | 30.5% | 0.0% | 0.0% | ||||||||||||||||||||||||
| 2024 | 1.5 | 4.1 | 98.4 | 5.1 | 973 | 22.7% | 43.9% | 33.4% | 04/20 | 05/04 | 05/07 | 05/18 | 06/14 | 06/17 | |||||||||||||||||||||
| 2023 | 1.4 | 3.0 | 99.2 | 4.3 | 989 | 15.6% | 52.1% | 32.4% | 04/18 | 05/11 | 05/16 | 05/30 | 06/15 | 06/18 | |||||||||||||||||||||
| 2022 | 1.9 | 5.7 | 96.9 | 1.4 | 1221 | 16.9% | 48.2% | 35.0% | 04/07 | 05/03 | 05/04 | 05/17 | 06/07 | 06/09 | |||||||||||||||||||||
| 2021 | 1.2 | 2.1 | 99.9 | 3.7 | 754 | 30.5% | 52.3% | 17.2% | 04/04 | 05/04 | 05/06 | 05/21 | 06/13 | 06/16 | |||||||||||||||||||||
| 2020 | 1.7 | 4.7 | 98.0 | 4.6 | 488 | 36.5% | 42.6% | 20.9% | 04/22 | 05/04 | 05/07 | 05/24 | 06/13 | 06/15 | |||||||||||||||||||||
| 2019 | 1.2 | 2.2 | 98.7 | 5.1 | 474 | 27.6% | 47.5% | 24.9% | 04/25 | 05/09 | 05/11 | 05/22 | 06/12 | 06/15 | |||||||||||||||||||||
| 2018 | 1.4 | 2.8 | 98.3 | 6.3 | 666 | 18.5% | 42.5% | 39.0% | 05/03 | 05/12 | 05/14 | 05/28 | 06/13 | 06/17 | |||||||||||||||||||||
| 2017 | 1.5 | 3.1 | 97.5 | 4.2 | 611 | 22.4% | 43.4% | 34.2% | 05/06 | 05/15 | 05/20 | 05/30 | 06/14 | 06/18 | |||||||||||||||||||||
| 2016 | 1.1 | 2.0 | 98.6 | 4.7 | 1252 | 27.1% | 41.6% | 31.3% | 04/10 | 05/02 | 05/06 | 05/17 | 06/12 | 06/16 | |||||||||||||||||||||
| 2015 | 1.2 | 2.1 | 99.2 | 2.7 | 2327 | 22.0% | 44.1% | 33.9% | 04/07 | 04/23 | 04/25 | 05/08 | 06/12 | 06/16 | |||||||||||||||||||||
| 2014 | 1.2 | 2.1 | 99.1 | 3.2 | 1940 | 23.6% | 43.4% | 33.1% | 04/09 | 04/30 | 05/03 | 05/15 | 06/13 | 06/17 | |||||||||||||||||||||
| IHR-LGS double reach | Average | 3.4 | median 8.3 range 4.5 - 16.6 |
97.4 | range 1.9 - 4.9 | 1053.0 | 23.9% | 45.5% | 30.6% | 0.0% | 0.0% | ||||||||||||||||||||||||
| 2024 | 3.3 | 8.3 | 97.3 | 3.9 | 973 | 22.7% | 43.9% | 33.4% | 04/20 | 05/04 | 05/07 | 05/18 | 06/14 | 06/17 | |||||||||||||||||||||
| 2023 | 3.1 | 7.0 | 98.7 | 4.5 | 989 | 15.6% | 52.1% | 32.4% | 04/18 | 05/11 | 05/16 | 05/30 | 06/15 | 06/18 | |||||||||||||||||||||
| 2022 | 4.4 | 12.6 | 96.1 | 4.6 | 1221 | 16.9% | 48.2% | 35.0% | 04/07 | 05/03 | 05/04 | 05/17 | 06/07 | 06/09 | |||||||||||||||||||||
| 2021 | 3.0 | 7.0 | 97.6 | 3.9 | 754 | 30.5% | 52.3% | 17.2% | 04/04 | 05/04 | 05/06 | 05/21 | 06/13 | 06/16 | |||||||||||||||||||||
| 2020 | 4.2 | 9.9 | 96.5 | 3.8 | 488 | 36.5% | 42.6% | 20.9% | 04/22 | 05/04 | 05/07 | 05/24 | 06/13 | 06/15 | |||||||||||||||||||||
| 2019 | 4.0 | 16.6 | 96.8 | 4.4 | 474 | 27.6% | 47.5% | 24.9% | 04/25 | 05/09 | 05/11 | 05/22 | 06/12 | 06/15 | |||||||||||||||||||||
| 2018 | 3.5 | 8.5 | 97.4 | 4.9 | 666 | 18.5% | 42.5% | 39.0% | 05/03 | 05/12 | 05/14 | 05/28 | 06/13 | 06/17 | |||||||||||||||||||||
| 2017 | 4.0 | 11.2 | 98.5 | 2.6 | 611 | 22.4% | 43.4% | 34.2% | 05/06 | 05/15 | 05/20 | 05/30 | 06/14 | 06/18 | |||||||||||||||||||||
| 2016 | 2.6 | 5.2 | 97.7 | 3.8 | 1252 | 27.1% | 41.6% | 31.3% | 04/10 | 05/02 | 05/06 | 05/17 | 06/12 | 06/16 | |||||||||||||||||||||
| 2015 | 2.5 | 4.5 | 96.7 | 1.9 | 2215 | 21.4% | 43.5% | 35.1% | 04/07 | 04/23 | 04/25 | 05/06 | 06/06 | 06/13 | |||||||||||||||||||||
| 2014 | 3.0 | 6.5 | 98.4 | 3.3 | 1940 | 23.6% | 43.4% | 33.1% | 04/09 | 04/30 | 05/03 | 05/15 | 06/13 | 06/17 | |||||||||||||||||||||
| IHR-LWG triple reach | Average | 5.1 | median 10.5 range 7.0 - 24.0 |
96.4 | range 0.9 - 6.5 | 1547.8 | 29.2% | 42.6% | 28.2% | 0.0% | 0.0% | ||||||||||||||||||||||||
| 2024 | 4.8 | 9.8 | 97.1 | 4.6 | 973 | 22.7% | 43.9% | 33.4% | 04/20 | 05/04 | 05/07 | 05/18 | 06/14 | 06/17 | |||||||||||||||||||||
| 2023 | 4.5 | 9.0 | 98.6 | 4.8 | 989 | 15.6% | 52.1% | 32.4% | 04/18 | 05/11 | 05/16 | 05/30 | 06/15 | 06/18 | |||||||||||||||||||||
| 2022 | 6.4 | 14.5 | 95.2 | 2.7 | 1221 | 16.9% | 48.2% | 35.0% | 04/07 | 05/03 | 05/04 | 05/17 | 06/07 | 06/09 | |||||||||||||||||||||
| 2021 | 4.4 | 8.8 | 96.8 | 4.6 | 754 | 30.5% | 52.3% | 17.2% | 04/04 | 05/04 | 05/06 | 05/21 | 06/13 | 06/16 | |||||||||||||||||||||
| 2020 | 6.2 | 12.4 | 95.9 | 4.1 | 488 | 36.5% | 42.6% | 20.9% | 04/22 | 05/04 | 05/07 | 05/24 | 06/13 | 06/15 | |||||||||||||||||||||
| 2019 | 5.8 | 18.1 | 95.6 | 4.8 | 474 | 27.6% | 47.5% | 24.9% | 04/25 | 05/09 | 05/11 | 05/22 | 06/12 | 06/15 | |||||||||||||||||||||
| 2018 | 5.3 | 10.8 | 96.8 | 6.5 | 666 | 18.5% | 42.5% | 39.0% | 05/03 | 05/12 | 05/14 | 05/28 | 06/13 | 06/17 | |||||||||||||||||||||
| 2017 | 6.4 | 14.5 | 96.1 | 5.4 | 611 | 22.4% | 43.4% | 34.2% | 05/06 | 05/15 | 05/20 | 05/30 | 06/14 | 06/18 | |||||||||||||||||||||
| 2016 | 4.1 | 7.7 | 96.8 | 4.0 | 1252 | 27.1% | 41.6% | 31.3% | 04/10 | 05/02 | 05/06 | 05/17 | 06/12 | 06/16 | |||||||||||||||||||||
| 2015 | 4.3 | 7.6 | 96.7 | 4.1 | 2327 | 22.0% | 44.1% | 33.9% | 04/07 | 04/23 | 04/25 | 05/08 | 06/12 | 06/16 | |||||||||||||||||||||
| 2014 | 4.7 | 9.0 | 97.9 | 3.5 | 1940 | 23.6% | 43.4% | 33.1% | 04/09 | 04/30 | 05/03 | 05/15 | 06/13 | 06/17 | |||||||||||||||||||||
| 2013 | 4.3 | 7.0 | 98.0 | 1.6 | 1388 | 26.7% | 39.7% | 33.6% | 04/06 | 05/02 | 05/04 | 05/16 | 06/14 | 06/17 | |||||||||||||||||||||
| 2012 | 4.5 | 8.1 | 96.2 | 0.9 | 1979 | 36.1% | 30.0% | 34.0% | 04/21 | 05/08 | 05/12 | 05/20 | 06/10 | 06/15 | |||||||||||||||||||||
| 2011 | 6.6 | 24.0 | 93.3 | 2.4 | 2820 | 38.9% | 33.2% | 28.0% | 04/04 | 05/06 | 05/07 | 05/18 | 06/16 | 06/18 | |||||||||||||||||||||
| 2010 | 5.4 | 11.9 | 96.1 | 1.7 | 4542 | 45.5% | 39.9% | 14.6% | 04/04 | 04/22 | 04/26 | 05/12 | 06/14 | 06/17 | |||||||||||||||||||||
| 2009 | 4.3 | 7.3 | 96.1 | 1.7 | 3366 | 39.0% | 43.2% | 17.8% | 04/18 | 05/06 | 05/09 | 05/22 | 06/15 | 06/18 | |||||||||||||||||||||
| 2008 | 5.3 | 10.9 | 97.2 | 4.5 | 2325 | 40.2% | 34.9% | 24.9% | 04/08 | 04/30 | 05/06 | 05/20 | 06/15 | 06/18 | |||||||||||||||||||||
| 2007 | 4.8 | 10.5 | 94.9 | 3.4 | 840 | 32.4% | 43.7% | 23.9% | 04/19 | 05/01 | 05/04 | 05/20 | 06/14 | 06/18 | |||||||||||||||||||||
| 2006 | 5.4 | 12.4 | 95.8 | 5.8 | 454 | 31.7% | 44.1% | 24.2% | 04/27 | 05/10 | 05/12 | 05/27 | 06/16 | 06/18 | |||||||||||||||||||||
| LMN-LGS | Average | 1.6 | median 5.1 range 2.8 - 14.0 |
98.0 | range 1.8 - 6.1 | 1027.5 | 23.6% | 45.4% | 31.0% | 0.0% | 0.0% | ||||||||||||||||||||||||
| 2025 | 0 | 0.0 | 1 | 0.0% | 100.0% | 0.0% | 04/12 | 04/12 | 04/12 | 04/12 | 04/12 | 04/12 | |||||||||||||||||||||||
| 2024 | 1.4 | 4.6 | 97.7 | 2.4 | 943 | 22.6% | 43.6% | 33.8% | 04/06 | 05/07 | 05/10 | 05/19 | 06/15 | 06/17 | |||||||||||||||||||||
| 2023 | 1.4 | 3.8 | 99.2 | 3.4 | 993 | 15.2% | 52.2% | 32.6% | 04/20 | 05/13 | 05/17 | 05/31 | 06/15 | 06/18 | |||||||||||||||||||||
| 2022 | 1.8 | 6.6 | 97.1 | 6.1 | 1156 | 16.9% | 47.9% | 35.2% | 04/10 | 05/05 | 05/07 | 05/20 | 06/08 | 06/13 | |||||||||||||||||||||
| 2021 | 1.5 | 5.1 | 97.7 | 3.7 | 749 | 30.6% | 51.9% | 17.5% | 04/07 | 05/05 | 05/07 | 05/22 | 06/13 | 06/17 | |||||||||||||||||||||
| 2020 | 1.9 | 6.1 | 97.3 | 3.4 | 482 | 36.9% | 41.9% | 21.2% | 04/24 | 05/06 | 05/08 | 05/28 | 06/14 | 06/17 | |||||||||||||||||||||
| 2019 | 2.3 | 14.0 | 97.2 | 3.7 | 468 | 27.1% | 47.9% | 25.0% | 04/28 | 05/10 | 05/12 | 05/24 | 06/13 | 06/16 | |||||||||||||||||||||
| 2018 | 1.7 | 6.2 | 97.7 | 4.2 | 645 | 18.4% | 41.7% | 39.8% | 05/05 | 05/13 | 05/16 | 05/30 | 06/13 | 06/17 | |||||||||||||||||||||
| 2017 | 2.0 | 9.2 | 99.0 | 1.8 | 598 | 21.9% | 43.5% | 34.6% | 05/08 | 05/16 | 05/21 | 06/01 | 06/15 | 06/18 | |||||||||||||||||||||
| 2016 | 1.2 | 3.3 | 98.0 | 3.0 | 1216 | 26.6% | 41.9% | 31.5% | 04/12 | 05/04 | 05/07 | 05/18 | 06/12 | 06/16 | |||||||||||||||||||||
| 2015 | 1.2 | 2.8 | 98.3 | 3.9 | 2154 | 21.0% | 43.1% | 35.8% | 04/04 | 04/24 | 04/27 | 05/07 | 06/06 | 06/12 | |||||||||||||||||||||
| 2014 | 1.5 | 4.1 | 98.6 | 2.3 | 1898 | 22.8% | 43.6% | 33.6% | 04/12 | 05/02 | 05/04 | 05/16 | 06/12 | 06/17 | |||||||||||||||||||||
| LMN-LWG double reach | Average | 3.4 | median 6.9 range 5.8 - 16.4 |
97.1 | range 2.5 - 5.5 | 1038.1 | 23.7% | 45.4% | 30.8% | 0.0% | 0.0% | ||||||||||||||||||||||||
| 2025 | 0 | 0.0 | 1 | 0.0% | 100.0% | 0.0% | 04/12 | 04/12 | 04/12 | 04/12 | 04/12 | 04/12 | |||||||||||||||||||||||
| 2024 | 2.9 | 6.0 | 97.5 | 3.2 | 943 | 22.6% | 43.6% | 33.8% | 04/06 | 05/07 | 05/10 | 05/19 | 06/15 | 06/17 | |||||||||||||||||||||
| 2023 | 2.9 | 5.9 | 99.0 | 3.8 | 993 | 15.2% | 52.2% | 32.6% | 04/20 | 05/13 | 05/17 | 05/31 | 06/15 | 06/18 | |||||||||||||||||||||
| 2022 | 3.8 | 9.0 | 96.1 | 4.1 | 1156 | 16.9% | 47.9% | 35.2% | 04/10 | 05/05 | 05/07 | 05/20 | 06/08 | 06/13 | |||||||||||||||||||||
| 2021 | 2.9 | 6.9 | 97.1 | 4.2 | 749 | 30.6% | 51.9% | 17.5% | 04/07 | 05/05 | 05/07 | 05/22 | 06/13 | 06/17 | |||||||||||||||||||||
| 2020 | 3.9 | 8.8 | 96.9 | 3.7 | 482 | 36.9% | 41.9% | 21.2% | 04/24 | 05/06 | 05/08 | 05/28 | 06/14 | 06/17 | |||||||||||||||||||||
| 2019 | 4.2 | 16.4 | 95.5 | 3.9 | 468 | 27.1% | 47.9% | 25.0% | 04/28 | 05/10 | 05/12 | 05/24 | 06/13 | 06/16 | |||||||||||||||||||||
| 2018 | 3.5 | 8.8 | 97.2 | 5.5 | 645 | 18.4% | 41.7% | 39.8% | 05/05 | 05/13 | 05/16 | 05/30 | 06/13 | 06/17 | |||||||||||||||||||||
| 2017 | 4.3 | 11.9 | 96.5 | 4.1 | 598 | 21.9% | 43.5% | 34.6% | 05/08 | 05/16 | 05/21 | 06/01 | 06/15 | 06/18 | |||||||||||||||||||||
| 2016 | 2.8 | 5.9 | 97.1 | 3.1 | 1216 | 26.6% | 41.9% | 31.5% | 04/12 | 05/04 | 05/07 | 05/18 | 06/12 | 06/16 | |||||||||||||||||||||
| 2015 | 2.9 | 5.8 | 97.3 | 3.1 | 2271 | 21.8% | 43.8% | 34.5% | 04/04 | 04/24 | 04/27 | 05/09 | 06/12 | 06/17 | |||||||||||||||||||||
| 2014 | 3.2 | 6.9 | 98.2 | 2.5 | 1898 | 22.8% | 43.6% | 33.6% | 04/12 | 05/02 | 05/04 | 05/16 | 06/12 | 06/17 | |||||||||||||||||||||
| LGS-LWG | Average | 1.4 | median 2.4 range 1.9 - 3.5 |
98.8 | range 1.3 - 5.0 | 973.3 | 23.3% | 45.1% | 31.6% | 0.0% | 0.0% | ||||||||||||||||||||||||
| 2024 | 1.2 | 2.0 | 99.3 | 3.7 | 883 | 22.5% | 43.5% | 34.0% | 04/08 | 05/09 | 05/12 | 05/20 | 06/15 | 06/19 | |||||||||||||||||||||
| 2023 | 1.2 | 1.9 | 99.3 | 4.3 | 946 | 14.9% | 51.8% | 33.3% | 04/24 | 05/15 | 05/19 | 06/01 | 06/15 | 06/18 | |||||||||||||||||||||
| 2022 | 1.5 | 2.8 | 97.8 | 1.4 | 1102 | 17.0% | 47.4% | 35.7% | 04/12 | 05/07 | 05/08 | 05/21 | 06/10 | 06/18 | |||||||||||||||||||||
| 2021 | 1.2 | 1.9 | 99.1 | 5.0 | 697 | 30.4% | 51.9% | 17.6% | 04/10 | 05/07 | 05/09 | 05/22 | 06/14 | 06/17 | |||||||||||||||||||||
| 2020 | 1.5 | 2.4 | 98.9 | 3.3 | 455 | 35.4% | 43.3% | 21.3% | 04/27 | 05/09 | 05/11 | 05/31 | 06/16 | 06/18 | |||||||||||||||||||||
| 2019 | 1.3 | 1.9 | 98.6 | 2.4 | 415 | 27.5% | 45.5% | 27.0% | 05/01 | 05/12 | 05/14 | 05/29 | 06/15 | 06/17 | |||||||||||||||||||||
| 2018 | 1.4 | 2.4 | 99.5 | 5.0 | 583 | 17.7% | 41.0% | 41.3% | 05/07 | 05/14 | 05/17 | 06/01 | 06/13 | 06/15 | |||||||||||||||||||||
| 2017 | 1.6 | 3.5 | 97.1 | 3.1 | 556 | 21.2% | 44.1% | 34.7% | 05/10 | 05/19 | 05/23 | 06/06 | 06/16 | 06/18 | |||||||||||||||||||||
| 2016 | 1.4 | 2.8 | 99.0 | 2.8 | 1165 | 26.4% | 41.4% | 32.2% | 04/13 | 05/06 | 05/08 | 05/19 | 06/12 | 06/16 | |||||||||||||||||||||
| 2015 | 1.5 | 3.2 | 99.2 | 1.5 | 2108 | 21.0% | 43.1% | 36.0% | 04/08 | 04/26 | 04/28 | 05/10 | 06/07 | 06/12 | |||||||||||||||||||||
| 2014 | 1.4 | 2.8 | 99.5 | 1.3 | 1796 | 22.2% | 43.2% | 34.6% | 04/14 | 05/04 | 05/06 | 05/17 | 06/11 | 06/16 | |||||||||||||||||||||
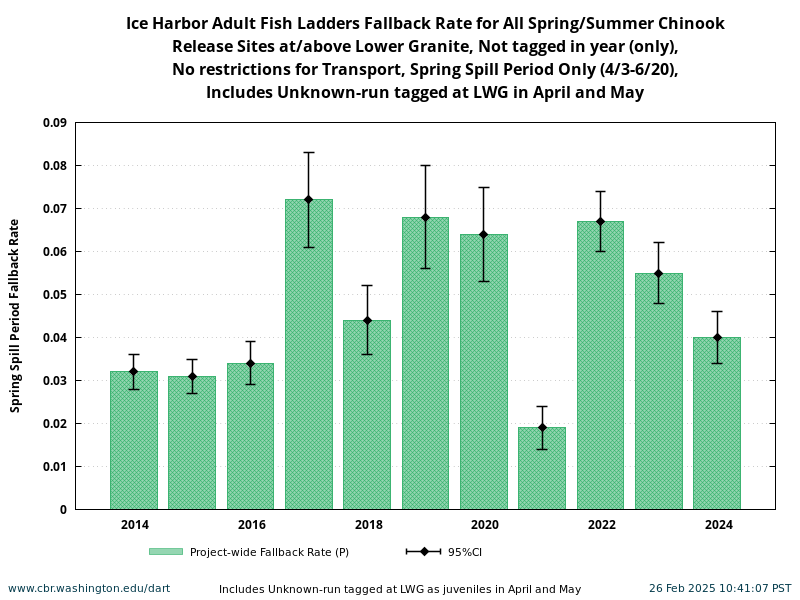
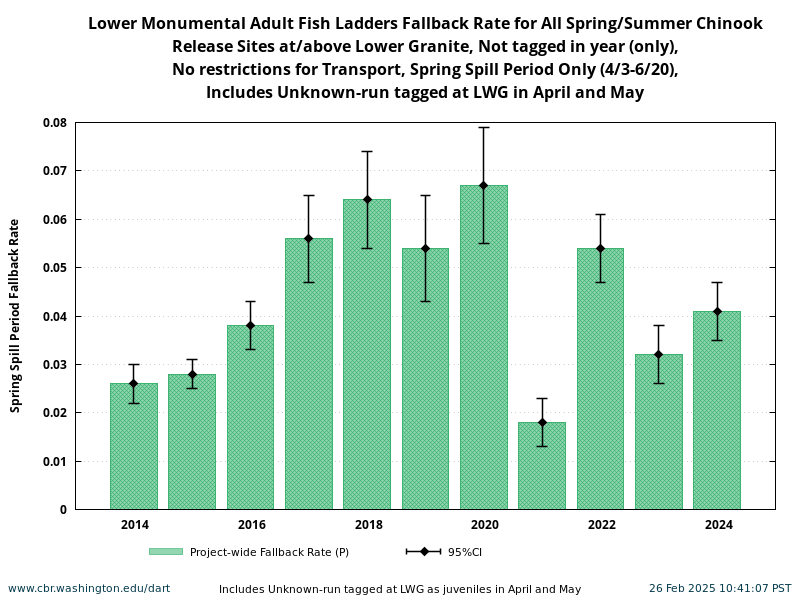
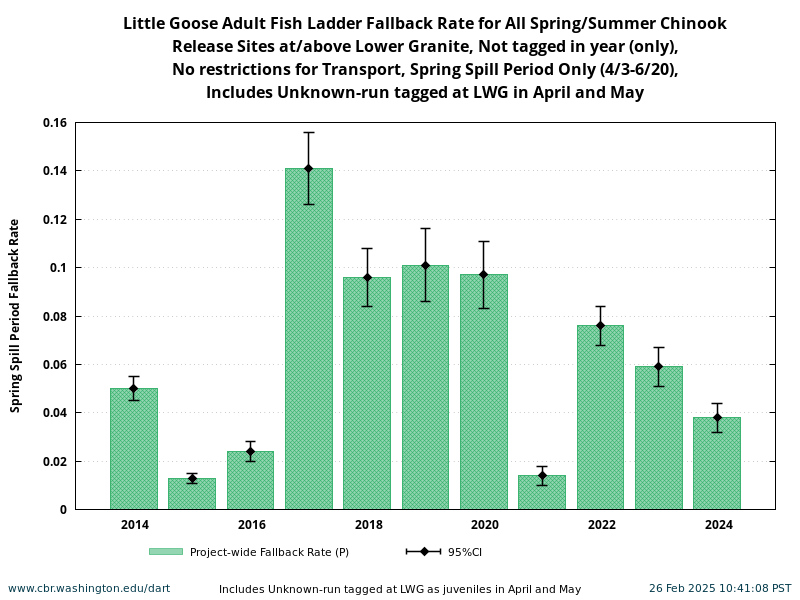
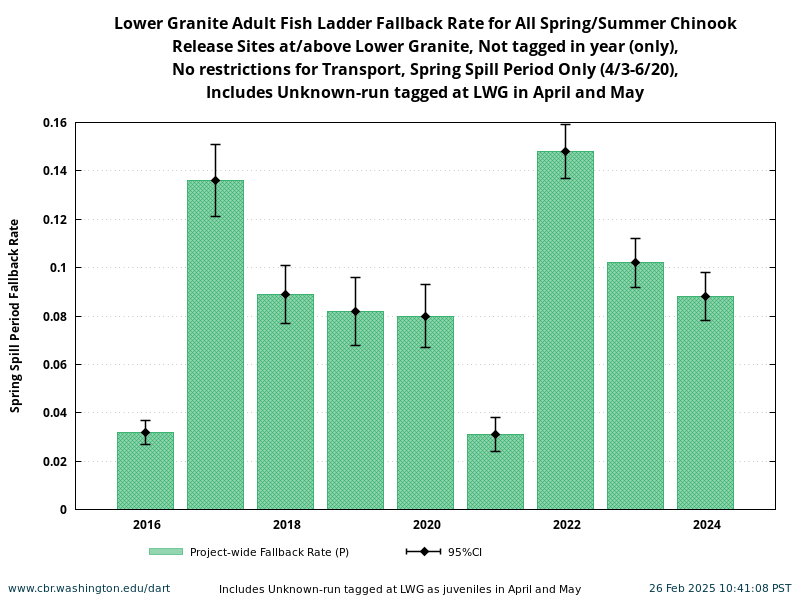
Select Historical Fallback -- Snake Basin Spring Spill Period
Provided here are fallback figures for spring-run and summer-run tagged Chinook juveniles released at/above Lower Granite including Unknown-run tagged at LWG in April and May detected during the spring-spill period at Snake River adult fishway ladders at Ice Harbor, Lower Monumental, Little Goose, and Lower Granite for all historical years. Click on each project's figure to view the annual fallback statistics for individual fishway ladders and the project as a whole.