PTAGIS System Outages 4/17 - 4/20: "Due to a PSMFC-wide infrastructure migration, the PTAGIS systems (website, reporting, data submission) will be inaccessible for periods of time between 4/17 and 4/20." DART will load PTAGIS data as it is made available. Thank you for your patience.

Columbia Basin Conditions All Years for Project

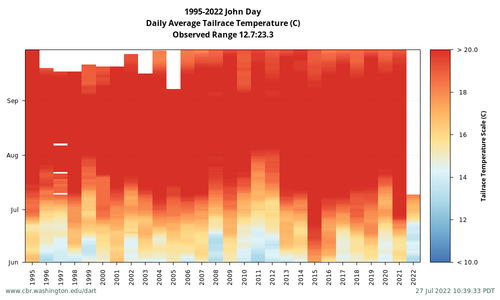
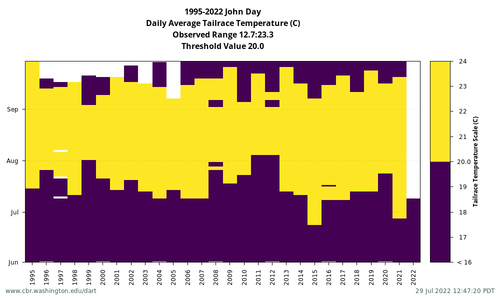
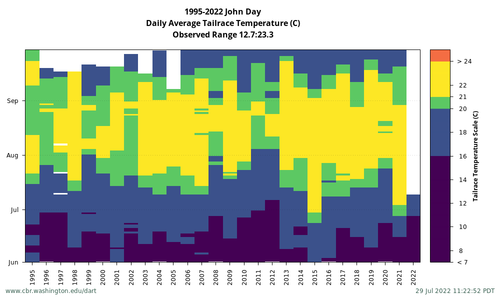
Data Courtesy of U.S. Army Corps of Engineers, NWD and Grant County PUD, U.S. Geological Survey Water Data, U.S. Bureau of Reclamation Columbia-Pacific Northwest Region Hydromet

Columbia Basin Conditions Queries

Select Location, River Data

Select Output Format

Set Heatmap Scale

Set Heatmap Color Palette
* asterick after palette indicates best options for color vision deficiency and B/W printing
Set Threshold Value    (2 color plot)

Select Month Range

Start    End

Month range is inclusive. To view only one month, select same month from both menus.

John Day, Tailrace Temperature Example: Heatmap Autoscale, Default Palette
John Day, Tailrace Temperature Example: Heatmap Range Max set, Default Palette, Month Range set
John Day, Tailrace Temperature Example: Heatmap Range Min<Max set, Viridis Palette
John Day, Tailrace Temperature Example: Threshold Plot, Month Range set
John Day, Tailrace Temperature Example: Temperature Biologic Plus, Month Range set
John Day, Tailrace Temperature Example: Line Plot